
SpreadCalculator - BossFXTrader
インジケーター
バージョン 1.0、May 2025
Windows、Mac
4.5
レビュー: 2

説明
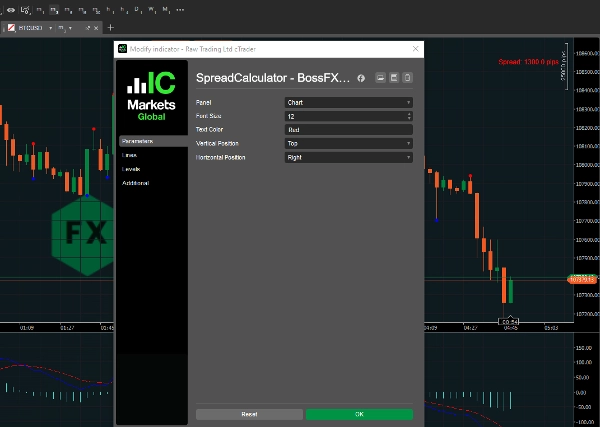
スプレッド計算機は、2つの価格または値の差を計算するために使用されるツールであり、取引における金融の文脈でよく使われます。潜在的な利益、損失、損益分岐点を判断し、取引シナリオにおける公正なオッズやラインを推定するのに役立ちます。
なぜこのインジケーターを使うのか?
- 正確な取引を行うために: 各通貨ペアや株式のリアルタイムスプレッドを正確に把握します。
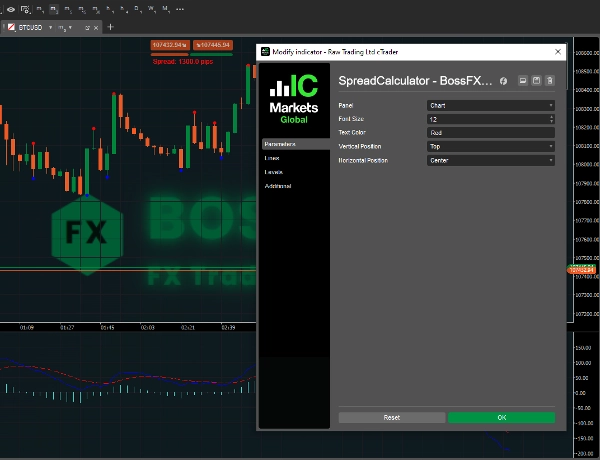
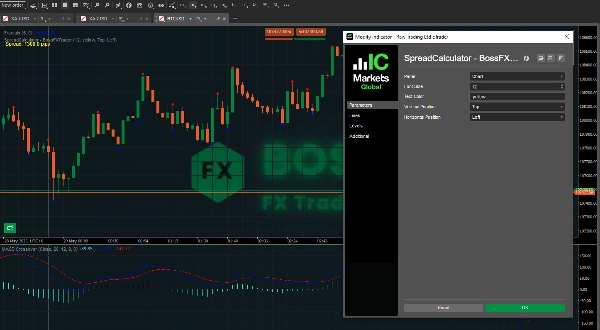
- 制御可能なポジションモード:フォントサイズ、テキストカラー、垂直および水平位置。
スプレッド計算機を使う利点は以下の通りです:
- 取引コストの理解:
スプレッドは取引の主要なコストであり、計算機は取引の開始や終了時にこのコストを視覚化するのに役立ちます。
- 戦略の最適化:
過去のスプレッドを分析することで、取引戦略を最適化し、全体の取引コストを削減できます。
- 情報に基づく意思決定:
計算機はスプレッドに関するデータを提供し、情報に基づいた準備された取引判断を可能にします。
- 証拠金要件の計算:
スプレッドベッティングでは、スプレッド計算機が取引に必要な証拠金、つまり口座に必要な資本額を決定するのに役立ちます。
- 潜在的な利益/損失の評価:
計算機は現在のスプレッドと取引サイズに基づいて、潜在的な利益または損失を推定することもできます。
- ブローカーの比較:
スプレッド計算機を使って異なるブローカーが提供するスプレッドを比較し、取引ニーズに最適なレートを提供するブローカーを選べます。
- オプション戦略の分析:
オプション取引では、スプレッド計算機がブル/ベアスプレッドなどのさまざまな垂直スプレッド戦略の分析に役立ちます。
- ビッド・アスク価格の理解:
スプレッドとは、ビッド(売り手が売りたい価格)とアスク(買い手が買いたい価格)の差です。
概要
インジケーターのプロフィール
カスタマーレビュー
4.5
レビュー: 2
5 | 50 % | |
4 | 50 % | |
3 | 0 % | |
2 | 0 % | |
1 | 0 % |
カスタマーレビュー
June 8, 2025
the part that matters is the watchlist is easier to scan, and a week of notes gives a better read.
May 30, 2025
ディスカッション
よくあるご質問
Forex
cTrader Storeで入手可能な取引ボット、インジケーター、プラグインなどの商品は、第三者の開発者が提供するものであり、情報と技術の取得のみを目的としてご利用いただけます。cTrader Storeはブローカーではなく、投資助言や個人的な推奨を行うことも、将来のパフォーマンスを保証することもありません。
この作成者の他の商品


価格
登録日 29/05/2025
3.04M
取引数量
45.22K
獲得pips
29
販売
771
無料インストール