

説明
1️⃣ このインジケーターは何をするのか?
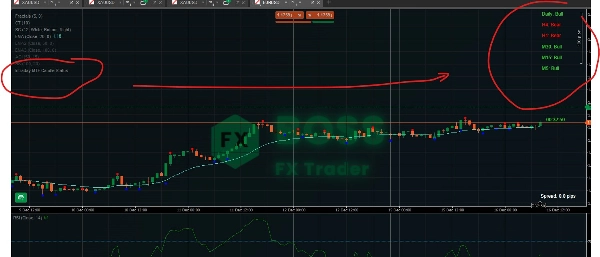
このツールは 複数の時間枠にわたるローソク足の方向をまとめて チャート上の一箇所に表示します。
各時間枠ごとに、最後に確定したローソク足 をチェックし、以下を表示します:
状態意味
🟢 ブル
終値 > 始値(買い手が優勢)
🔴 ベア
終値 < 始値(売り手が優勢)
⚪ ドージー
終値 ≈ 始値(迷い)
表示される時間枠:
- 日足
- H4
- H1
- M30
- M15
- M5
すべての状態は チャート上に直接表示される ため、時間枠を切り替える必要がありません。
2️⃣ なぜこのツールは強力なのか
🔥 トレーダーのよくある問題を解決
ほとんどのトレーダーはこう尋ねます:
「私は 上位時間枠のトレンドに沿って 取引しているのか、それとも逆らっているのか?」
このインジケーターはそれに 即座に 答えます。
推測する代わりに:
- あなたは トレンドの整合性 を確認できます
- あなたは 逆トレンドのエントリーを避ける ことができます
- あなたは タイミングと自信を向上させる ことができます
3️⃣ インジケーターの動作原理
📌 ローソク足の状態ロジック
- 最後に確定したローソク足(
Last(1))を使用 - 再描画なし
- 信頼できる確認
📌 マルチタイムフレームデータ
- 各時間枠から実際のローソク足データを取得
- 現在のチャート時間枠に依存しない
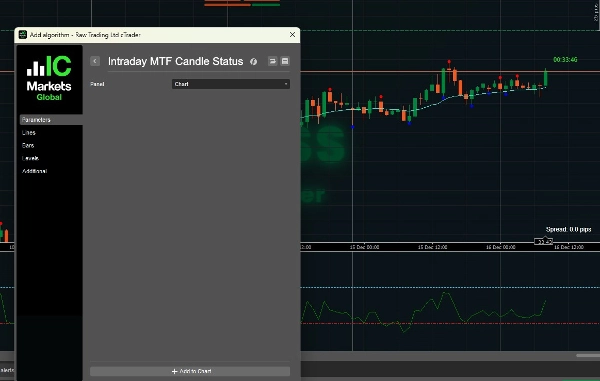
📌 チャート上の表示
- テキストラベルを 右上エリア に描画
- 即時判読のため色分け
- すべてのティックで更新
4️⃣ 効果的な使い方(トレーディングシナリオ)
🟢 シナリオ1:トレンド確認(最適な使用例)
✔ ルール:
上位・下位時間枠が一致したときのみ取引する
例:
日足:ブル
H4:ブル
H1:ブル
M15:ブル
M5:ブル
✅ 高確率の買い環境
使用例:
- 押し目買い
- ブレイクアウト
- 継続エントリー
❌ ここでの売りは避ける
🔴 シナリオ2:逆トレンド警告
日足:ブル
H4:ブル
H1:ベア
M15:ベア
M5:ベア
⚠️ 市場は 押し目調整中 であり、反転ではありません。
最善の対応:
- M5/M15が再び ブルに転じる のを待つ
- 売りを追いかけるのを避ける
- サポートでの 買いのセットアップを探す
⚪ シナリオ3:レンジ相場 / もみ合い
日足:ブル
H4:ドージー
H1:ドージー
M15:ベア
M5:ブル
🚫 低品質な条件
推奨:
- ポジションサイズを減らす
- ブレイクアウトトレードを避ける
- 相場の構造が明確になるのを待つ
5️⃣ スキャルピング戦略例(M5エントリー)
🔹 理想的な買いセットアップ
- 日足 → ブル
- H4 → ブル
- H1 → ブル
- M15 → ブル
- M5 → ベア → ブルに転換
📍 エントリー:
- M5が再び ブル に変わったとき
- 以下と組み合わせる:
-
- サポート
- フラクタル
- EMA / VWAP
🔹 理想的な売りセットアップ
逆のロジック:
- 上位時間枠 → ベア
- M5の押し目完了でエントリー
6️⃣ 最適な時間枠の組み合わせ
トレードスタイル焦点時間枠
スキャルピング
H1 → M15 → M5
日中取引
H4 → H1 → M15
スイング
日足 → H4 → H1
7️⃣ このツールが「ではない」もの
🚫 単独のエントリーシグナルではない
🚫 反転インジケーターではない
🚫 構造やプライスアクションの代替ではない
✅ これは バイアス&確認ツール
8️⃣ 組み合わせると良いインジケーター
強く推奨される組み合わせ:
- ✅ フラクタル(すでに使用中)
- ✅ マーケット構造(HH / LL)
- ✅ サポート&レジスタンス
- ✅ EMA 50 / EMA 200
- ✅ VWAP
9️⃣ このツールを使ったプロのトレードルール
✔ HTFの方向にのみ取引する
✔ LTFはエントリータイミングのみに使用する
✔ 日足とH4が不一致のときはシグナルを無視する
✔ 混合シグナル時は過剰取引を避ける
✔ 構造でローソク足のバイアスを確認する
🔟 最終まとめ
IntradyMultiTimeframeCandleStatus = マーケットバイアスダッシュボード
これにより得られるもの:
- 即時のトレンドの明確さ
- 高確率のトレード
- 感情的な判断の減少
- よりクリーンな実行
ぜひ私たちの製品をご覧ください。
概要
カスタマーレビュー
5 | 100 % | |
4 | 0 % | |
3 | 0 % | |
2 | 0 % | |
1 | 0 % |


![「High-Low Divergence [Iridio Capital]」ロゴ](https://cdn.ctrader.com/image/webp/443c4661-7abb-40f1-842f-4b6ec560649b_40914)


![「Smart Money Concepts (SMC) [Iridio Capital]」ロゴ](https://cdn.ctrader.com/image/webp/28b69fd1-ef54-4bed-9487-07e78e883be4_40934)


![「[Hamster-Coder] Pivot Points MTF」ロゴ](https://cdn.ctrader.com/image/webp/4c143e5a-309c-40e3-a578-f04d1e133ffa_31159)


