
KDJ
مؤشر
255 التنزيلات
الإصدار 1.0، Dec 2024
Windows, Mac
5.0
التقييمات: 1
الوصف
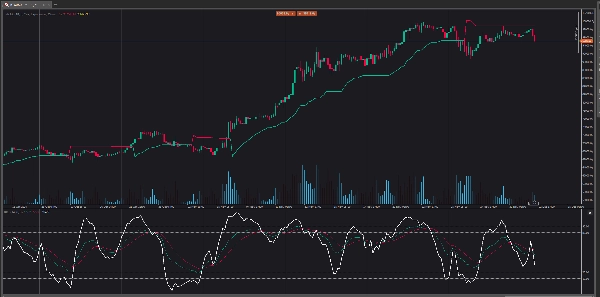
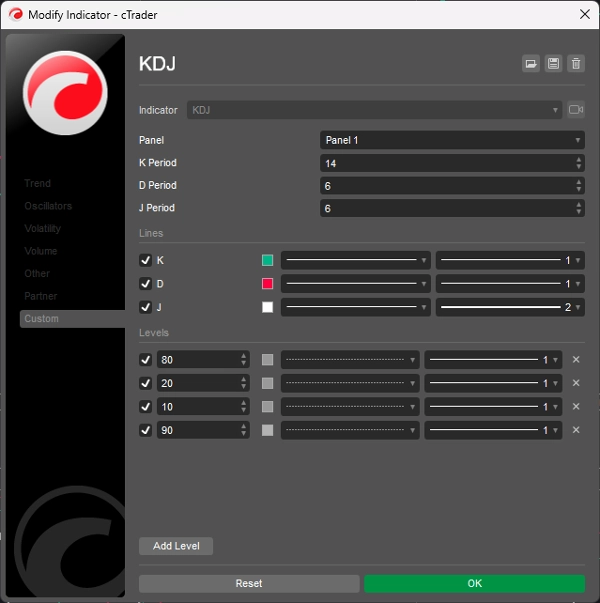
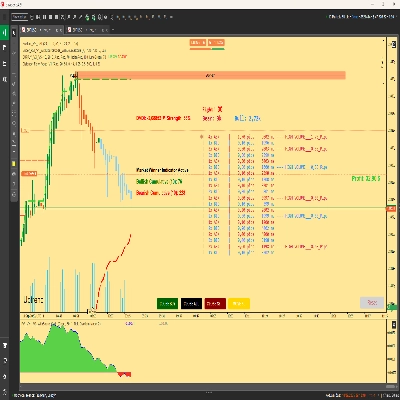
يتكون عرض مذبذب KDJ من 3 خطوط (K و D و J - ومن هنا جاء اسم العرض) ومستويين. K و D هما نفس الخطوط عند استخدام المذبذب العشوائي. يمثل خط J انحراف قيمة D عن قيمة K. يشير تقارب هذه الخطوط إلى فرص تداول جديدة. مثل المذبذب العشوائي، تتوافق مستويات التشبع الشرائي والبيعي مع الأوقات التي من المحتمل أن ينقلب فيها الاتجاه.
الملخص
ملخص الذكاء الاصطناعي
The KDJ indicator is an oscillator consisting of three lines: K, D, and J, along with two reference levels. The K and D lines correspond to those used in the stochastic oscillator, while the J line measures the deviation of the D value from the K value. This convergence of the three lines is used to identify potential new trading opportunities. Similar to the stochastic oscillator, the KDJ indicator highlights overbought and oversold conditions, which often signal possible trend reversals. This tool is designed to assist traders in timing entries and exits by analyzing momentum and trend strength through these oscillating lines.
ملف تعريف المؤشر
تقييمات العملاء
5.0
التقييمات: 1
5 | 100 % | |
4 | 0 % | |
3 | 0 % | |
2 | 0 % | |
1 | 0 % |
تقييمات العملاء
August 18, 2025
Pros: Three-line stochastic oscillator (K, D, J) that identifies overbought/oversold levels and momentum shifts. Supports divergence analysis and crossovers between K and D as trading signals. Lightweight and responsive. Cons: No alerts, tooltips, or settings presets. J‑line can generate outlier v
مناقشة
الأسئلة الشائعة
يتم توفير المنتجات المتاحة من خلال cTrader Store، بما في ذلك روبوتات التداول والمؤشرات والإضافات، من قبل مطوري الطرف الثالث وإتاحتها لأغراض الوصول المعلوماتي والفني فقط. cTrader Store ليس وسيطًا ولا يقدم نصائح استثمارية أو توصيات شخصية أو أي ضمان للأداء المستقبلي.


![شعار "Gaussian Channel [Iridio Capital]"](https://cdn.ctrader.com/image/webp/7c039209-5573-4a54-a072-f9528b503103_41960)


السعر
2
المبيعات
6.9K
التثبيتات المجانية