
Descrição
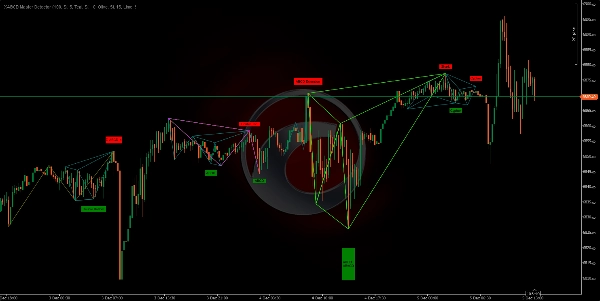
Este ALGORITMO é uma ferramenta técnica avançada 🔧 projetada para automatizar a detecção de padrões geométricos de preço (Padrões Harmônicos) e estruturas de mercado baseadas em ação de preço. Seu objetivo principal é identificar zonas potenciais de reversão de tendência de alta probabilidade 📍.
https://chartshots.spotware.com/c/693330cd99c57
O que este algoritmo faz?
O algoritmo escaneia o gráfico em tempo real 🔍 procurando por formações específicas de preço. Ele funciona em dois níveis:
- Mapeamento de Estrutura (ZigZag): Primeiro, ele simplifica o ruído do mercado desenhando linhas "ZigZag" conectando máximas e mínimas relevantes (pivôs). Ele usa até 4 comprimentos diferentes simultaneamente 📏 para capturar tanto tendências pequenas (curto prazo) quanto grandes (longo prazo).
- Reconhecimento de Padrões: Uma vez que esses pontos pivôs (pontos A, B, C, D, X) são identificados, o algoritmo mede as distâncias e razões entre eles. Se essas razões corresponderem às regras matemáticas dos padrões clássicos de trading (como Fibonacci), o indicador desenha o padrão e alerta o usuário 🚨.
Para que serve?
Serve para eliminar a subjetividade ao traçar padrões complexos e economizar tempo de análise ⏳. Em vez de medir manualmente cada retração e extensão de Fibonacci, o indicador faz isso automaticamente para:
- Detectar Reversões: Encontrar pontos onde o preço pode virar (de alta para baixa ou vice-versa). 🔄
- Identificar Pontos de Entrada: Sinalizar zonas precisas (a "Zona Potencial de Reversão") para entrar no mercado. 🎯
- Confirmar Análise: Servir como confluência adicional para sua própria estratégia de suporte/resistência.
Lógica por trás dos cálculos
O núcleo do indicador é baseado em Razões de Fibonacci e simetria de mercado ⚖️. O algoritmo verifica regras estritas para cada padrão. Por exemplo, para confirmar um padrão "Gartley", o algoritmo calcula internamente:
- Se a retração do ponto B em relação à perna XA é exatamente (ou muito próxima de) 0.618.
- Se a projeção do ponto D atende proporções específicas.
O indicador permite uma pequena margem de erro (configurável) porque o mercado raramente é perfeito até o último pip. Ele também calcula a relação risco/recompensa teórica antes de exibir um padrão.
Padrões que detecta:
https://chartshots.spotware.com/c/6933314cb9fa1
- Clássicos: Topo Duplo e Fundo Duplo. 🏔️🏞️
- Harmônicos: Gartley, Morcego 🦇, Borboleta 🦋, Caranguejo 🦀, Caranguejo Profundo, Tubarão 🦈, Cypher.
- Estruturas ABCD: ABCD clássico, AB=CD, ABCD estendido.
- Exóticos: Three Drives, 5-0.
https://chartshots.spotware.com/c/6933317ae4324
Como usar?
Configuração Visual:
- Você verá linhas coloridas conectando picos e vales.
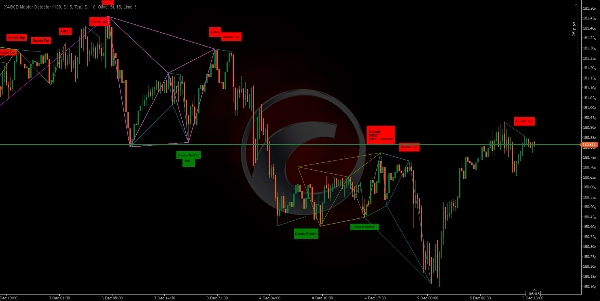
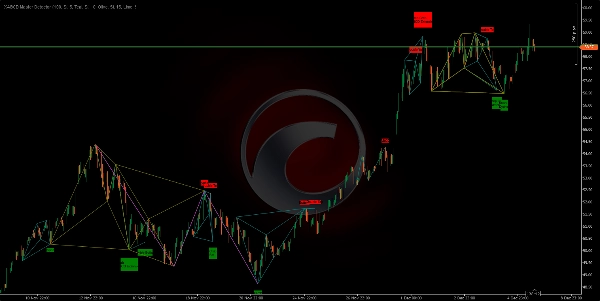
- Quando um padrão estiver completo, uma figura geométrica colorida e uma etiqueta com o nome do padrão (ex.: "Gartley", "Topo Duplo") aparecerão.
- Etiquetas Verdes: Indicam padrões de alta (procure compras). 📈
- Etiquetas Vermelhas: Indicam padrões de baixa (procure vendas). 📉
Interpretação:
- Não negocie toda etiqueta cegamente. Use-a como um sinal de alerta.
- Quando um padrão aparecer, espere o preço reagir na zona D (o último ponto do padrão).
- Procure confirmação adicional (como um candle de reversão japonês ou divergência no RSI) antes de entrar.
Ajustes Chave:
- Você pode ativar ou desativar padrões específicos se preferir negociar apenas alguns (ex.: somente "Morcego" e "Gartley"). ✅
- Você pode ajustar a sensibilidade dos ZigZags para ver movimentos mais rápidos ou tendências mais lentas. ⚙️
🏆 Mais de 10.000 Traders Confiam em Nossa Suite de 25+ Algoritmos! 🏆
De Estrutura de Mercado & Liquidez até Sistemas Inteligentes de Saída & Ferramentas Preditivas - construímos TODAS as ferramentas que você precisa para consistência.
👉 Acesse Todos os 25+ Sistemas COMPROVADOS:
_______________________________________________
📌 Indicadores de Estrutura de Mercado
· ✅ AdvancedMarket Structure: Bos, Choch, SwinLevels, Order Blocks, Market Structure& Liquidity Finder
· 🔄 Dynamic Market StructureAnalysis of Turning Points
· 🧱 Order Block
· ⚖️ Market Imbalance
· ⛓️ BOS & CHOCH
· 🧠 ICT Power of 3
_______________________________________________
🔚 Sistemas Inteligentes de Saída
_______________________________________________
📐 Indicadores ZigZag
· 🔍 ZigZag Price LiquidityProjection
· ➖ ZigZag
_______________________________________________
🧱 Indicadores de Suporte & Resistência
· 🟩 SmartTrend Support &Resistance Lines
· 🧱 All Support and ResistanceLevels
_______________________________________________
📊 Indicadores de Tendência & Canal
· 📊 Supertrend
_______________________________________________
💧 Ferramentas de Volume & Liquidez
_______________________________________________
⚡ Indicadores de Momentum & RSI
· 🔎 Multi-Level Candle Bias
Tracker
_______________________________________________
🔮 Ferramentas de Previsão & Projeção
· 📐 Previsão Baseada em Linreg& ATR
· 📏 Regressão Linear FibonacciMulti-timeframe
· 📈 Projetor de Fluxo de Mercado Potencializado por Volume_________________________
_________________________________________________________________________________________________
_________________________________________________________________________________________________
DISPARADOR DE CANAL RSI: 📶
O que é: Um indicador que calcula o RSI(período) e marca visualmente zonas de momentum quando o RSI cruza os limites de sobrecompra/sobrevenda (padrão 70/30). ✅
https://chartshots.spotware.com/c/69278f8b6d973
Lógica: Quando um limite é cruzado, ele cria uma "zona" baseada na máxima/mínima do candle no momento do cruzamento. Então: 🧠
- Colore os candles dentro dessa zona.
- Desenha um canal (máxima, mínima, meio).
- Marca o cruzamento no painel do RSI com um círculo e uma etiqueta.
A zona dura exatamente MinZoneDuration barras. ⏱️
Sinais claros:
- Cruzamento acima da Sobrecompra → inicia uma zona de alta. 🟢
- Cruzamento abaixo da Sobrevenda → inicia uma zona de baixa. 🔴
A própria zona é uma área de interesse, não uma ordem.
https://chartshots.spotware.com/c/69278fb274e0b
Como usar (rápido):
- Espere a zona se formar. 🎯
- Confirme com ação de preço (ruptura/rejeição das linhas do canal).
- Entre com um stop loss fora da zona e um alvo na linha do meio do canal ou numa relação risco/recompensa definida.
https://chartshots.spotware.com/c/69278fe76237b
Parâmetros Chave: ⚙️
- Período do RSI (14)
- Sobrecompra (70)
- Sobrevenda (30)
- MinZoneDuration (15)
- Cores configuráveis 🎨
Resumo
The algorithm recognizes classic and complex patterns—including Double Top/Bottom, Gartley, Bat, Butterfly, Crab, Deep Crab, Shark, Cypher, ABCD structures, and exotic patterns like Three Drives and 5-0—by measuring distances and Fibonacci ratios between pivot points. Upon pattern completion, it visually displays colored geometric figures and labels indicating bullish (green) or bearish (red) signals.
Users can customize pattern detection and ZigZag sensitivity to suit their trading preferences. The indicator supports various markets such as Forex, commodities, indices, stocks, and cryptocurrencies, including symbols like EURUSD, GBPUSD, BTCUSD, XAUUSD, NAS100, and USDJPY.
XABCD Master Detector aims to reduce subjectivity and save analysis time by automatically calculating Fibonacci retracements, extensions, and theoretical risk/reward ratios. It serves as an alert tool to detect reversals, identify entry points, and provide additional confluence to existing support/resistance strategies.
Avaliações de clientes
5 | 100 % | |
4 | 0 % | |
3 | 0 % | |
2 | 0 % | |
1 | 0 % |


