
StochasticRSI
مؤشر
1.16K التنزيلات
الإصدار 1.0، Nov 2024
Windows, Mac
5.0
التقييمات: 1
الوصف
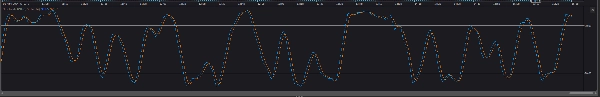
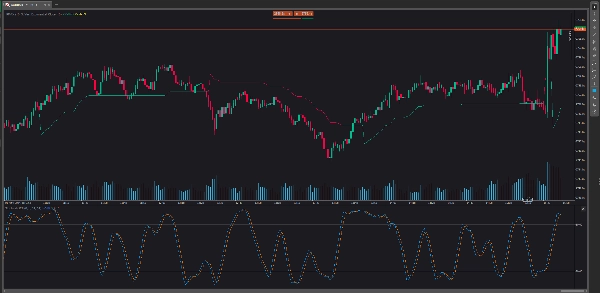
مؤشر القوة النسبية العشوائي (StochRSI) هو مؤشر تحليل فني يُستخدم لدعم التنبؤ بسوق الأسهم من خلال مقارنة نطاق سعر الورقة المالية بسعر إغلاقها. يتميز StochRSI بتركيزه على زخم السوق وهو جيد في قراءة حالات السوق المبالغ في شرائها والمبالغ في بيعها. يختلف StochRSI عن المؤشرات الفنية الأخرى، مثل مؤشر القوة النسبية (RSI)، لأنه ينتقل من أسعار المبالغة في الشراء إلى المبالغة في البيع أسرع من مؤشر القوة النسبية.
الملخص
ملخص الذكاء الاصطناعي
Stochastic RSI (StochRSI) is a technical analysis indicator designed to assess market momentum by comparing a security's price range to its closing price. It is used primarily to identify overbought and oversold conditions in stock markets, providing faster signals than the traditional Relative Strength Index (RSI). Unlike RSI, StochRSI moves more rapidly between overbought and oversold levels, making it useful for traders seeking timely momentum insights. This indicator supports analysis across various indices and is categorized under momentum indicators, specifically related to RSI.
ملف تعريف المؤشر
تقييمات العملاء
5.0
التقييمات: 1
5 | 100 % | |
4 | 0 % | |
3 | 0 % | |
2 | 0 % | |
1 | 0 % |
تقييمات العملاء
July 9, 2025
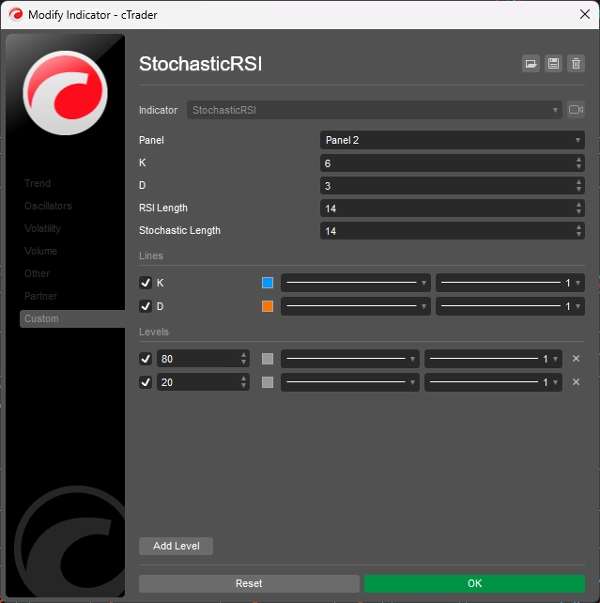
Pros: Combines Stochastic Oscillator and RSI for improved overbought/oversold detection. Easy to set up, stable on all timeframes. Cons: No tooltips or alerts. Requires confirmation from trend indicators to avoid false signals. Limited customization options.
مناقشة
الأسئلة الشائعة
Indices
RSI
يتم توفير المنتجات المتاحة من خلال cTrader Store، بما في ذلك روبوتات التداول والمؤشرات والإضافات، من قبل مطوري الطرف الثالث وإتاحتها لأغراض الوصول المعلوماتي والفني فقط. cTrader Store ليس وسيطًا ولا يقدم نصائح استثمارية أو توصيات شخصية أو أي ضمان للأداء المستقبلي.
المزيد من هذا المؤلف


السعر
2
المبيعات
6.92K
التثبيتات المجانية