Mô tả
Cách mạng hóa Phân tích Biểu đồ của Bạn
Bước vào tương lai của phân tích kỹ thuật với Delta-RSI Candle Pro – chỉ báo sáng tạo biến những cây nến thông thường thành công cụ trực quan hóa động lượng mạnh mẽ. Tại sao phải làm lộn xộn màn hình với nhiều chỉ báo khi bạn có thể có tất cả những gì cần thiết ngay trên chính các cây nến?
Giải pháp Giao dịch Thị giác Tất cả trong Một
-
- Nhận diện Tín hiệu Ngay lập tức: Sức mạnh và hướng động lượng được hiển thị trực quan qua màu sắc
- Tối đa hóa Không gian Màn hình: Loại bỏ hoàn toàn các bảng dao động riêng biệt
- Độ chính xác Toán học: Hồi quy đa thức tiên tiến tính toán động lượng RSI thực sự
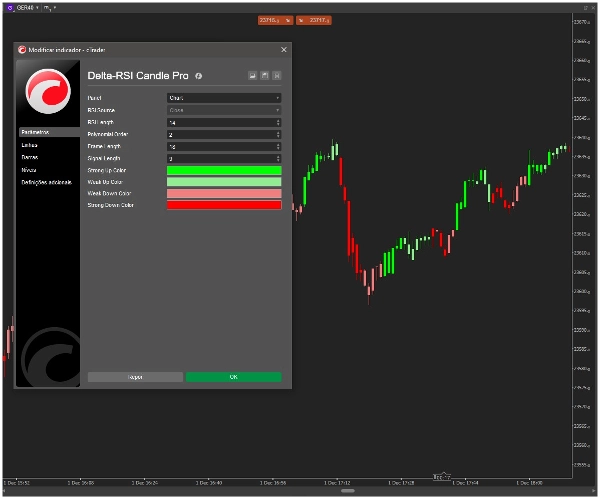
- Tùy chỉnh Hoàn chỉnh: Sử dụng bộ chọn màu gốc của cTrader để phù hợp với phong cách giao dịch của bạn
- Đáng tin cậy & Chính xác: Tính toán không vẽ lại dựa trên dữ liệu giá đã xác nhận
Cách Delta-RSI Candle Pro Hoạt động
Thuật toán độc quyền của chúng tôi tính toán đạo hàm tức thời của RSI sử dụng phương pháp khớp đường cong đa thức, sau đó gán màu sắc thông minh cho từng cây nến:
-
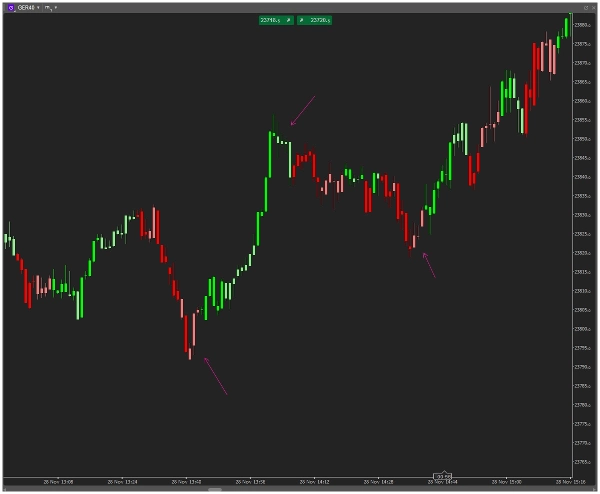
- Tăng giá Mạnh mẽ: Xanh lá đậm – Động lượng tích cực đang tăng tốc
- Tăng giá Nhẹ: Xanh lá nhạt – Động lượng tích cực nhưng cần thận trọng
- Giảm giá Nhẹ: Đỏ nhạt – Động lượng tiêu cực nhưng có khả năng đảo chiều
- Giảm giá Mạnh mẽ: Đỏ đậm – Động lượng tiêu cực đang tăng tốc
Các Tính năng Chính Làm Chúng Tôi Khác Biệt
-
- 🎯 Tích hợp Trực tiếp trên Nến: Màu sắc xuất hiện trực tiếp trên các cây nến giao dịch của bạn
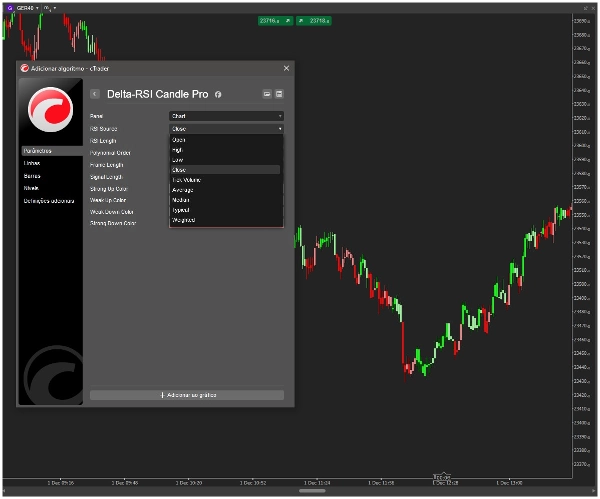
- 🎨 Lựa chọn Màu sắc Thị giác: Bộ chọn màu trực quan của cTrader – không cần tên mã
- ⚙️ Hoàn toàn Điều chỉnh được: Tinh chỉnh độ dài RSI, bậc đa thức và khoảng thời gian nhìn lại
- 🚀 Hiệu suất Tối ưu: Bộ máy tính toán nhẹ giúp vận hành mượt mà
- 📊 Thuật toán Chuẩn chuyên nghiệp: Phân tích đạo hàm toán học cho tín hiệu vượt trội
Ai Lợi Ích Nhiều Nhất?
-
- Nhà giao dịch trong ngày cần tín hiệu động lượng trực quan tức thì
- Nhà giao dịch Swing nhận biết thay đổi xu hướng sớm
- Nhà giao dịch tối giản ghét sự lộn xộn trên biểu đồ
- Nhà giao dịch thuật toán tìm kiếm xác nhận thị giác
- Tất cả Nhà giao dịch nghiêm túc muốn có lợi thế trong phân tích thị trường
Bắt đầu trong Vài Giây
-
- Thêm Delta-RSI Candle Pro vào biểu đồ của bạn
- Chọn màu ưa thích bằng bộ chọn màu trực quan
- Điều chỉnh các tham số phù hợp với khung thời gian giao dịch của bạn
- Ngay lập tức thấy các mẫu động lượng xuất hiện trên các cây nến
Sự Xuất sắc Kỹ thuật
-
- Loại chỉ báo phủ (không có bảng riêng biệt)
- Thuật toán không vẽ lại
- Tính toán đạo hàm đa thức của RSI
- Tương thích với tất cả các ký hiệu và khung thời gian
- Cập nhật và cải tiến thường xuyên
Tại sao Điều này Khác biệt
Trong khi các chỉ báo khác làm tăng sự phức tạp, Delta-RSI Candle Pro đơn giản hóa và nâng cao. Chúng tôi đã áp dụng phân tích động lượng toán học tiên tiến và làm cho nó trực quan về mặt thị giác. Không còn phải chia sự chú ý giữa giá và các chỉ báo – giờ đây chúng hoạt động cùng nhau như một hệ thống thống nhất.
Sẵn sàng để nhìn thấy biểu đồ của bạn theo một cách cách mạng mới?...
Tóm tắt
Key features include immediate visual signal recognition through candle coloring, elimination of separate oscillator panels to maximize chart space, and advanced mathematical precision with non-repainting calculations based on confirmed price data. Users can fully customize colors and parameters such as RSI length, polynomial order, and lookback period using cTrader’s native color pickers.
Delta-RSI Candle Pro is compatible with all symbols and timeframes and is optimized for smooth performance with a lightweight calculation engine. It is suitable for day traders, swing traders, minimalist traders, algorithmic traders, and others seeking clear, integrated momentum analysis without chart clutter. The indicator overlays directly on price candles, providing a cohesive system that combines price and momentum information visually.
Đánh giá của khách hàng
5 | 100 % | |
4 | 0 % | |
3 | 0 % | |
2 | 0 % | |
1 | 0 % |