
Mô tả
Chỉ báo Break of Structure (BoS CHoCH) là một công cụ cấu trúc thị trường thông minh được thiết kế để giúp các nhà giao dịch dễ dàng phát hiện tiếp diễn xu hướng và đảo chiều xu hướng trong thời gian thực. Bằng cách tự động phát hiện các đỉnh và đáy dao động, công cụ này xác định các điểm Break of Structure (BoS) và Change of Character (ChoCh) — cung cấp cho bạn các tín hiệu giao dịch rõ ràng, có thể hành động với các dấu hiệu trực quan ngay trên biểu đồ của bạn.
🔎 Cách hoạt động
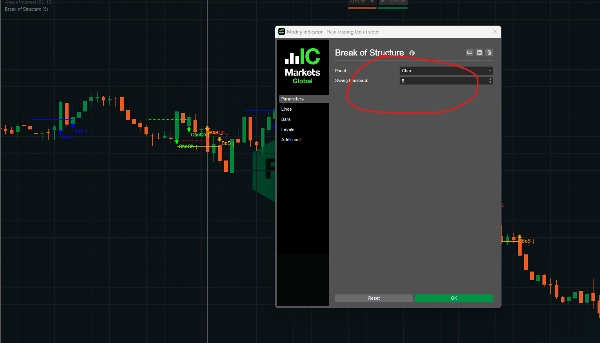
- Sử dụng khoảng thời gian nhìn lại để phát hiện các đỉnh/đáy dao động.
- BoS và ChoCh được phát hiện bằng cách so sánh giá hiện tại với các điểm cấu trúc trước đó.
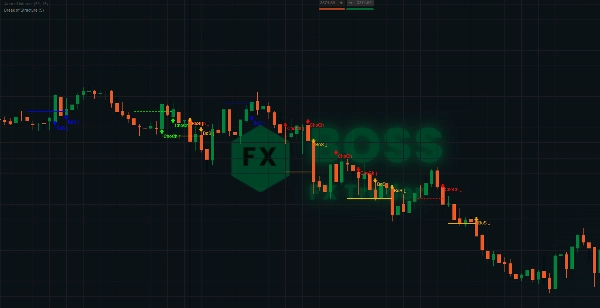
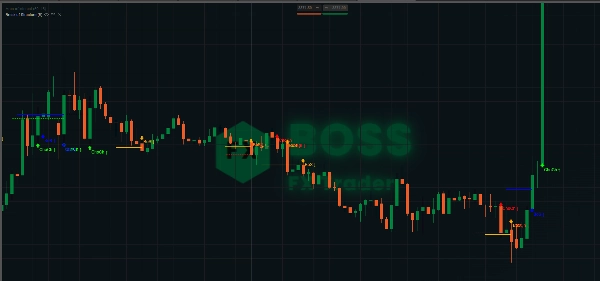
- Khi ChoCh được xác nhận (giá phá vỡ LH hoặc HL trước đó), một tín hiệu giao dịch được kích hoạt.
- Break of Structure (BoS): Hiển thị với nhãn và mũi tên (tiếp diễn xu hướng).
- Change of Character (ChoCh): Hiển thị với nhãn và mũi tên khác (đảo chiều xu hướng).
- Phát hiện đỉnh/đáy dao động được sử dụng để theo dõi và cập nhật các điểm cấu trúc một cách động.
⚡ Tính năng chỉ báo
- ✅ Phát hiện BoS: Đánh dấu khi giá phá vỡ Đỉnh Cao hơn (HH) hoặc Đáy Thấp hơn (LL) gần đây.
- ✅ Phát hiện ChoCh: Đánh dấu khi giá phá vỡ Đỉnh Thấp hơn (LH) hoặc Đáy Cao hơn (HL).
- ✅ Nhãn và Mũi tên trực quan: Tín hiệu dễ đọc được vẽ trực tiếp trên biểu đồ.
- ✅ Theo dõi xu hướng: Đơn giản hóa việc nhận biết các thay đổi cấu trúc thị trường.
Chỉ báo BoS của BossFXTrader mang lại cho các nhà giao dịch một lợi thế trực quan trong việc hiểu hành động giá. Dù bạn đang giao dịch tiếp diễn hay đảo chiều, công cụ này làm nổi bật những khoảnh khắc quan trọng trong cấu trúc thị trường để bạn có thể vào lệnh với sự tự tin.
Tóm tắt
Đánh giá của khách hàng
5 | 100 % | |
4 | 0 % | |
3 | 0 % | |
2 | 0 % | |
1 | 0 % |


