

说明
深度情绪分布 (DMD) 📊🧠
概述
深度情绪分布 (DMD) 是一个分段的成交量剖面和情绪工具,分析固定柱块中的价格行为并显示:
- 交易活动集中的位置 ⚖️
- 流动性稀薄或反应性的位置(潜在的供需/流动性区域)💧
- 每个价格区域主导的一方(买方与卖方)🐂🐻
DMD不是单一的滑动剖面,而是将图表分割成重复的X柱块,并为每个块构建独立的流动性和情绪图谱。
这使得直观比较成交量分布和市场情绪如何从一个段落变化到下一个段落变得简单。
工作原理 🧩
对于每个Bars In Profile蜡烛块:
- 指标找到该块的最高价和最低价。
- 价格范围被分割成
Number of Rows个垂直价格区间。 - 对于块中的每根蜡烛:
-
- 成交量按蜡烛范围触及的每个价格区间分配。
- 每行累计两种成交量:
-
- 该价格行的总成交量
- 看涨成交量(仅限收盘价>开盘价的柱)
- 基于这些,DMD构建:
-
- 流动性剖面(右侧)
-
- 行长度 ∝ 相对于该块最大行成交量的相对成交量
- 颜色显示高/平均/低成交节点
- 情绪剖面(左侧)
-
- 每行情绪 =
2 × BullishVolume − TotalVolume - 正值 = 买方主导(看涨情绪)
- 负值 = 卖方主导(看跌情绪)
- 每行情绪 =
- 该过程对最近的N个块重复,以便您可以并排比较多个段落。
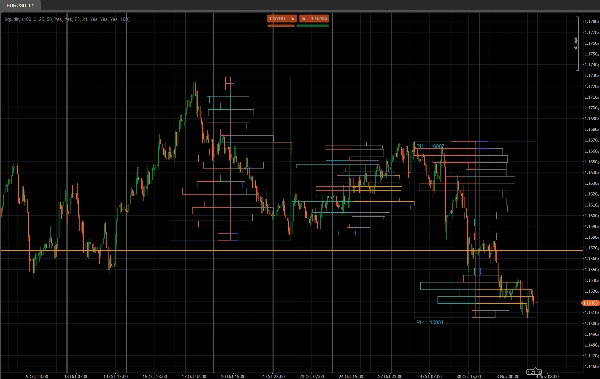
右侧 – 流动性剖面(成交量)📊
右侧柱显示每个价格水平的交易活动(成交量),在该块内,无论买卖双方是谁。
- 高成交量节点 (HVN) – 例如橙色柱
-
- 行的成交量≥
高成交阈值%,相对于该块最大行成交量 - 代表价值区,重度交易,整合区。
- 行的成交量≥
- 低成交量节点 (LVN) – 例如蓝色柱
-
- 行的成交量≤
低成交阈值%,相对于最大行成交量 - 代表稀薄流动性区,可能的拒绝或快速移动区域。
- 行的成交量≤
- 平均成交量节点 – 例如灰色柱
-
- 介于高低阈值之间的所有成交量
- “正常”成交水平,非极端。
🧠 柱长度(右侧)
→ 与该价格行的总成交量相对于该块最大成交量成比例。
成交量越多 → 柱越长。
关键参数:
高成交阈值%低成交阈值%
左侧 – 情绪剖面(市场情绪)🧠📉📈
左侧柱显示每个价格水平的情绪/主导:该行买方或卖方更强。
对于每行:
情绪=2×看涨成交量−总成交量
- 看涨柱(买方控制) – 例如青绿色柱
-
- 情绪 > 0
- 更多成交量来自看涨蜡烛(收盘价 > 开盘价)在该价格。
- 表示该价格行的买方主导。
- 看跌柱(卖方控制) – 例如红色柱
-
- 情绪 < 0
- 更多成交量来自看跌蜡烛(收盘价 < 开盘价)。
- 表示卖方主导。
🧠 柱长度(左侧)
→ 与情绪的绝对值(|情绪|)相对于该块最强行成比例。
主导越强(买卖双方不平衡越大)→ 柱越长。
关键参数:
显示情绪剖面(开/关)
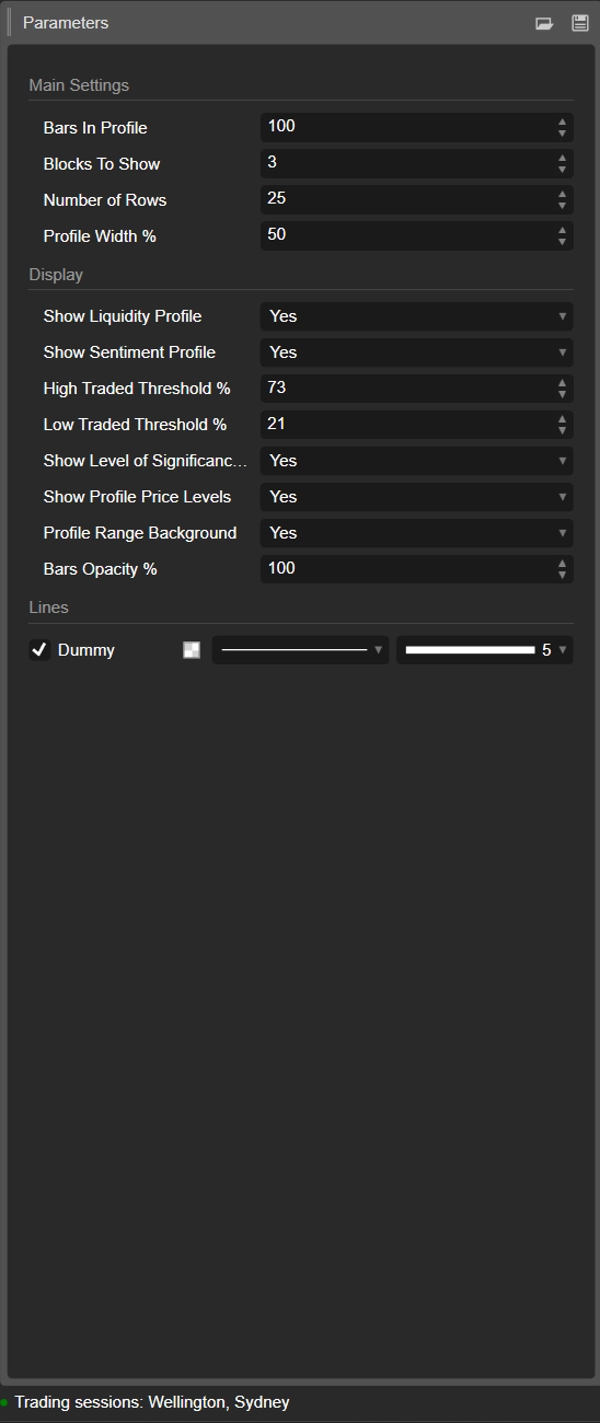
参数详情 ⚙️
1. Bars In Profile
组别: 主设置
每个块包含的蜡烛数量。
- 示例:
Bars In Profile = 100 -
- 块0 → 最近100根柱
- 块1 → 之前的100根柱
- 块2 → 再之前的100根,依此类推。
用它来匹配块到:
- 大致交易时段,
- 您典型的波段/日内区间,
- 或任何您想分析的自定义窗口。
值越小 = 越灵敏,越细致。
值越大 = 越平滑,更“宏观”的结构。
2. Blocks To Show
组别: 主设置
图表上绘制多少连续块。
1→ 仅最近的块2–3→ 非常实用的比较,且不杂乱- 更高的值 → 更多历史,但图表对象更多
超过此值的旧块会自动清理以保持稳定性。
3. Number of Rows
组别: 主设置
每个块剖面的垂直分辨率。
块的价格范围被划分为这么多行(价格水平)。
- 值越高 → 细节越多,行越薄,矩形越多
- 值越低 → 结构越平滑,更易阅读
典型范围:
15–25用于正常日内交易30–40+仅当您需要非常细致的分辨率且平台足够强大时使用
4. Profile Width %
组别: 主设置
控制剖面从块中心水平延伸的距离,按块宽度的百分比计算。
- 影响流动性(右侧)和情绪(左侧)。
- 百分比越高 → 剖面延伸到周围柱更远
- 百分比越低 → 剖面紧凑,靠近块中心
推荐起始值:35–50%。
5. 显示流动性剖面
组别: 显示
开启或关闭成交量分布(流动性剖面)(每块右侧)。
- 开 ✅
-
- 每行长度反映该价格水平的相对成交量。
- 颜色编码高/平均/低成交节点。
- 关 ❌
-
- 仅显示情绪(如果启用),右侧无成交量柱。
6. 显示情绪剖面
组别: 显示
开启或关闭情绪剖面(每块左侧)。
- 开 ✅
-
- 行颜色:
-
- 看涨(买方主导)– 例如水绿色/绿色
- 看跌(卖方主导)– 例如红色
- 行长度反映主导强度。
- 关 ❌
-
- 仅显示纯流动性/成交量分布。
如果您想看到不仅是成交量在哪里,而且是谁在这些水平更活跃,请使用此功能。
7. 高成交阈值%
组别: 显示
定义每个块内高成交量节点 (HVN)的截止值。
- 以块最大行成交量的百分比表示。
- 示例:最大行成交量 = 10,000;阈值 = 70% → 行成交量≥7,000计为HVN。
HVN通常标记:
- 价值区,
- 整合区,
- 强势持仓/公允价值区域。
8. 低成交阈值%
组别: 显示
定义相对于块最大成交量的低成交量节点 (LVN)的截止值。
- 成交量低于此百分比的行被视为低活跃区。
- 这些区域可作为:
-
- 稀薄流动性口袋,
- 潜在拒绝水平,
- 或价格倾向快速穿越的区域。
典型使用范围:15–30%。
9. 显示重要性水平 (POC)
组别: 显示
显示或隐藏最近块的控制点 (POC)。
- POC = 该块中最高成交量的价格行。
- 以该价格的水平线显示。🎯
用途:
- 均值回归参考,
- 日内“公允价格”锚点,
- 或交易管理的关键水平。
10. 显示剖面价格水平
组别: 显示
显示以下文本标签:
- 剖面高点 (PH) – 块内达到的最高价
- 剖面低点 (PL) – 块内达到的最低价
标签显示在最近的块上,并包含精确的价格值。
适用于:
- 快速读取当前区间,
- 在PH/PL附近设置止损/目标,
- 突破或轮动的背景。
11. 剖面范围背景
组别: 显示
绘制半透明背景矩形,覆盖每个块的:
- 时间范围(起始到结束柱)
- 价格范围(低到高)
这视觉上分隔块,使每个范围突出。
如果您喜欢更简洁的视觉效果,可以禁用它。
12. 柱透明度%
组别: 显示
控制矩形(流动性和情绪柱)是实心还是淡化。
- 20–40% → 非常浅,背景风格
- 50–70% → 视觉平衡,蜡烛仍清晰可见
- 80–100% → 强烈,几乎完全不透明的块
内部此值转换为条颜色的alpha通道(0–255)。
建议起始模板 ⭐
适用于指数/期货日内(M5–M15):
- Bars In Profile: 80–120
- Blocks To Show: 2–3
- Number of Rows: ~20
- Profile Width %: 35–45
- Show Liquidity Profile: true
- Show Sentiment Profile: true
- Bars Opacity %: 50–65
摘要
Key features include:
- Liquidity Profile (right side): Displays trading volume concentration at each price level within a block, highlighting high-volume nodes (HVNs), low-volume nodes (LVNs), and average-volume nodes. Bar length corresponds to relative traded volume, and colors indicate volume intensity.
- Sentiment Profile (left side): Shows buyer vs. seller dominance per price level, calculated as twice the bullish volume minus total volume. Positive values indicate buy-side control; negative values indicate sell-side control. Bar length reflects the strength of dominance, with color coding for bullish (green/teal) and bearish (red) sentiment.
- Configurable parameters: number of bars per profile block, number of blocks displayed, vertical resolution (rows), profile width, opacity, and thresholds for defining HVNs and LVNs.
- Additional display options: Point of Control (POC) line for highest volume price in the latest block, profile high/low price labels, and background shading for block ranges.
DMD supports analysis across various markets including indices, commodities, forex, and cryptocurrencies, facilitating identification of trading activity concentration, liquidity zones, and market sentiment shifts within customizable timeframes.
客户评价
5 | 0 % | |
4 | 100 % | |
3 | 0 % | |
2 | 0 % | |
1 | 0 % |


