

说明
1️⃣ 这个指标的作用是什么?
这个工具 汇总多个时间框架的蜡烛方向,并在您的图表上集中显示。
对于每个时间框架,它检查 最后关闭的蜡烛 并显示:
状态含义
🟢 多头
收盘价 > 开盘价(买方控制)
🔴 空头
收盘价 < 开盘价(卖方控制)
⚪ 十字星
收盘价 ≈ 开盘价(犹豫不决)
显示的时间框架:
- 日线
- 4小时
- 1小时
- 30分钟
- 15分钟
- 5分钟
所有状态都显示在 图表本身,因此您无需切换时间框架。
2️⃣ 为什么这个工具强大
🔥 解决交易者的常见问题
大多数交易者会问:
“我是在 顺势 还是 逆势 进行高时间框架趋势的交易?”
这个指标能 立即 给出答案。
不必猜测:
- 您可以看到 趋势一致性
- 您避免了 逆势入场
- 您提升了 时机和信心
3️⃣ 指标如何工作
📌 蜡烛状态逻辑
- 使用 最后关闭的蜡烛(
Last(1)) - 无重绘
- 可靠的确认
📌 多时间框架数据
- 从每个时间框架获取真实蜡烛数据
- 独立于您当前所在的图表时间框架
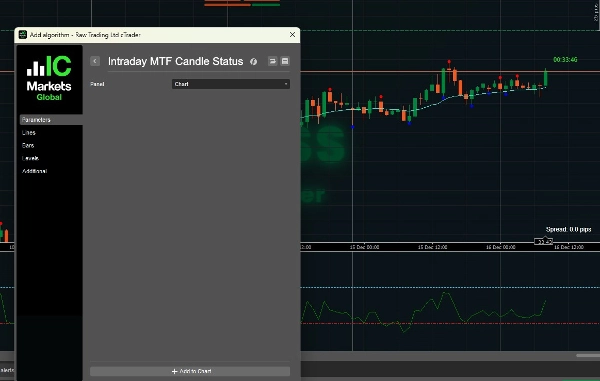
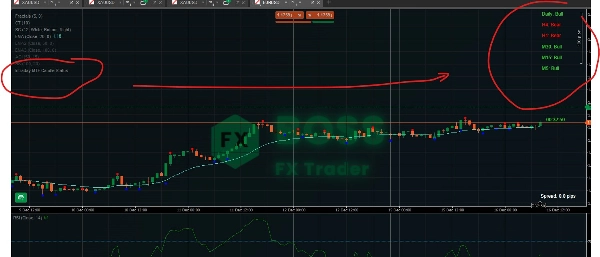
📌 图表上显示
- 在 右上角区域 绘制文本标签
- 颜色编码,便于即时识别
- 每个tick更新
4️⃣ 如何有效使用(交易场景)
🟢 场景1:趋势确认(最佳用例)
✔ 规则:
仅当高低时间框架一致时交易
示例:
日线:多头
4小时:多头
1小时:多头
15分钟:多头
5分钟:多头
✅ 高概率买入环境
使用:
- 回调
- 突破
- 延续入场
❌ 避免此处卖出
🔴 场景2:逆势警告
日线:多头
4小时:多头
1小时:空头
15分钟:空头
5分钟:空头
⚠️ 市场处于 回调,而非反转。
最佳操作:
- 等待5分钟/15分钟再次转为 多头
- 避免追空
- 寻找 支撑位的买入机会
⚪ 场景3:震荡/区间市场
日线:多头
4小时:十字星
1小时:十字星
15分钟:空头
5分钟:多头
🚫 低质量条件
建议:
- 减少仓位大小
- 避免突破交易
- 等待结构明朗
5️⃣ 剥头皮策略示例(5分钟入场)
🔹 理想买入设置
- 日线 → 多头
- 4小时 → 多头
- 1小时 → 多头
- 15分钟 → 多头
- 5分钟 → 空头 → 转为多头
📍 入场:
- 当5分钟再次转为 多头
- 结合:
-
- 支撑
- 分形
- EMA / VWAP
🔹 理想卖出设置
相反逻辑:
- 更高时间框架 → 空头
- 在5分钟回调完成时入场
6️⃣ 最佳时间框架组合
交易风格关注时间框架
剥头皮
1小时 → 15分钟 → 5分钟
日内交易
4小时 → 1小时 → 15分钟
波段交易
日线 → 4小时 → 1小时
7️⃣ 这个工具不是
🚫 本身不是入场信号
🚫 不是反转指标
🚫 不能替代结构/价格行为
✅ 它是一个 偏向和确认工具
8️⃣ 最佳搭配指标
强烈推荐的组合:
- ✅ 分形(您已经在使用)
- ✅ 市场结构(高点/低点)
- ✅ 支撑与阻力
- ✅ EMA 50 / EMA 200
- ✅ VWAP
9️⃣ 使用此工具的专业交易规则
✔ 仅 顺应高时间框架方向交易
✔ 仅用低时间框架进行 入场时机判断
✔ 当日线和4小时不一致时忽略信号
✔ 混合信号时避免过度交易
✔ 让结构确认蜡烛偏向
🔟 最终总结
IntradyMultiTimeframeCandleStatus = 市场偏向仪表盘
它为您提供:
- 即时趋势清晰度
- 更高概率的交易
- 更少的情绪化决策
- 更清晰的执行
查看我们的产品。
摘要
客户评价
5 | 100 % | |
4 | 0 % | |
3 | 0 % | |
2 | 0 % | |
1 | 0 % |


!["[Hamster-Coder] Moving Average MTF" 标识](https://cdn.ctrader.com/image/webp/b11b98b1-194d-4b8e-b00e-d611826ad159_31226)

