
Mô tả
Động lực xu hướng nâng cao với Dải Bollinger Dao động
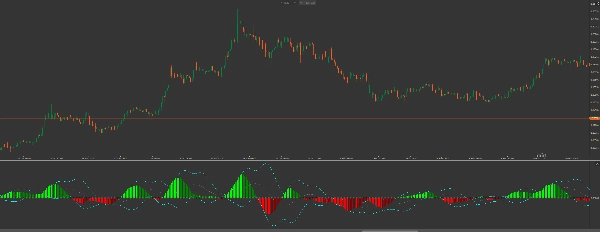
Bộ công cụ Squeeze Pro: Bộ công cụ Động lượng & Biến động là một bộ công cụ cấp tổ chức dành cho cTrader. Không giống như các chỉ báo tiêu chuẩn, bộ công cụ này cung cấp phân tích hai lớp về hành vi thị trường: nó xác định Giai đoạn Nén (nén thị trường) và theo dõi Cực điểm Động lượng bằng cách sử dụng Dải Bollinger được tính trực tiếp trên chính dao động.
Các Đổi mới Chính
-
- Dải Bollinger Động lượng: Loại đầu tiên trong lĩnh vực này. Bằng cách áp dụng Dải Bollinger cho biểu đồ động lượng, bạn có thể xác định các mức động lượng "quá mua" hoặc "quá bán" — hoàn hảo để định thời điểm thoát trước khi xu hướng cạn kiệt.
- Phát hiện Nén Ba Trạng thái:
-
- Chấm Đen (Nén Bật): Nén cao. Thị trường đang "cuộn" để chuẩn bị cho một đợt bứt phá lớn.
- Chấm Xám (Nén Tắt): Biến động đang mở rộng. Đợt di chuyển đã bắt đầu.
- Chấm Xanh Dương (Không Nén): Điều kiện thị trường bình thường.
- Làm Mượt Hồi Quy Tuyến Tính: Sử dụng thuật toán
CalculateLinearRegressiontinh chỉnh để lọc bỏ nhiễu giá, cung cấp biểu đồ động lượng mượt mà và đáng tin cậy. - Logic Chồng Lớp Đôi: Hoạt động trong cửa sổ chỉ báo riêng biệt để giữ cho biểu đồ giá của bạn sạch sẽ trong khi cung cấp những hiểu biết phân tích sâu sắc.
Hướng Dẫn Trí Tuệ Thị Giác:
-
- Biểu đồ động lượng (Xu hướng & Sức mạnh)
-
- Màu Chanh: Động lượng tăng đang tăng tốc (Mua mạnh).
- Màu Xanh Lá: Động lượng tăng đang chậm lại (Chốt lời).
- Màu Đỏ: Động lượng giảm đang tăng tốc (Bán mạnh).
- Màu Đỏ Đậm: Động lượng giảm đang chậm lại (Người bán cạn kiệt).
- Dải Dao động (Các đường "Xanh Lơ")
-
- Khi các thanh biểu đồ động lượng vượt ra ngoài Dải Bollinger Xanh Lơ, xu hướng hiện tại đang ở mức cực đoan về mặt thống kê. Hãy tìm các tín hiệu đảo chiều hoặc điều chỉnh lớn khi biểu đồ động lượng bắt đầu rút lại vào trong các dải này.
Chiến lược Giao dịch: "Đột phá Mạnh mẽ"
-
- Xác định Nén: Chờ Chấm Đen xuất hiện trên đường số không. Điều này báo hiệu "sự yên tĩnh trước cơn bão."
- Xác nhận Hướng đi: Tìm thanh biểu đồ động lượng đầu tiên màu Chanh (Mua) hoặc Đỏ (Bán).
- Kích hoạt: Vào lệnh khi Nén Tắt (Chấm xám) xuất hiện, báo hiệu năng lượng được giải phóng.
- Thoát lệnh: Chốt lời khi biểu đồ động lượng chuyển từ màu Chanh sang Xanh Lá, HOẶC khi biểu đồ động lượng chạm đến Dải Bollinger Trên của Dao động, báo hiệu sự cạn kiệt.
Tại sao nâng cấp lên Squeeze Pro?
Trong khi các chỉ báo cơ bản cho bạn biết giá đã đi đến đâu, Squeeze Pro cho bạn thấy áp lực đằng sau đợt di chuyển. Bằng cách quan sát đồng thời nén và các dải động lượng, bạn tránh được việc vào các xu hướng đã cạn kiệt và bắt được những đợt bứt phá mạnh mà người khác bỏ lỡ.
Ghi chú của Nhà phát triển: Chỉ báo này được tối ưu hóa cao cho API của cTrader, đảm bảo không có độ trễ hiệu suất ngay cả trên các máy cấu hình thấp trong khi xử lý các phép tính hồi quy tuyến tính phức tạp theo thời gian thực.
Tóm tắt
Key features include linear regression smoothing to reduce price noise, a dual-overlay display that keeps the price chart uncluttered, and a color-coded histogram that visually represents bullish and bearish momentum strength and changes. When histogram bars move outside the oscillator’s Bollinger Bands (cyan lines), it signals statistically extreme momentum levels, useful for timing entries and exits.
The indicator supports a "Power Breakout" trading strategy: traders wait for squeeze signals, confirm momentum direction via histogram colors, enter trades on squeeze release, and exit when momentum shows signs of exhaustion. This suite provides institutional-grade insights into trend pressure and momentum dynamics, helping traders identify potential explosive moves and avoid exhausted trends.
Đánh giá của khách hàng
5 | 0 % | |
4 | 100 % | |
3 | 0 % | |
2 | 0 % | |
1 | 0 % |


