说明
Signal Strike 是一款为 ctrader 设计的专业交易指标,能够在您的图表上直接提供清晰且高置信度的入场信号。该工具采用结合趋势、动量、波动性和成交量确认的先进逻辑,帮助交易者自信地识别精准的买入和卖出机会。
与通用指标不同,Signal Strike 专门设计用于过滤犹豫不决的蜡烛和弱势形态。当条件满足时,指标会直接在图表上绘制入场、止损和止盈水平,并显示置信度百分比。如果未检测到有效形态,指标将在图表顶部显示“无有效买入/卖出信号”,让您始终清楚何时行动,何时观望。
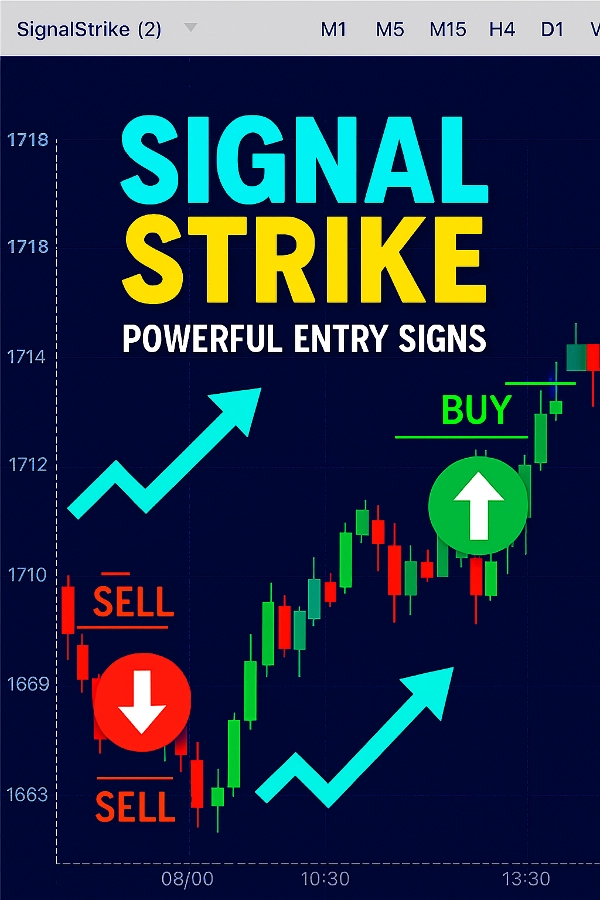
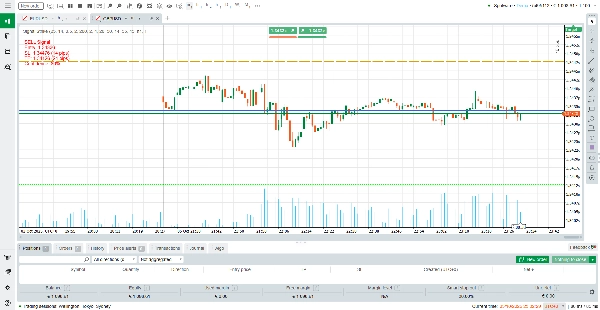
在 Signal Strike 中,每种线条颜色都有明确含义,帮助交易者快速读取图表。入场线以蓝色绘制,标记触发交易形态的准确价格。止损线以橙色显示,表示如果市场逆向移动,交易将被关闭的保护水平。
止盈线以青柠绿色显示,突出显示锁定利润的目标水平。为了方向清晰,买入信号以绿色强调,卖出信号以红色突出。这些强烈且饱和的颜色确保每个元素都显眼,使您一目了然区分入场、风险和收益区域。
如何读取信号
买入信号:出现绿色向上箭头和标签,显示入场价、止损、止盈及置信度水平。
卖出信号:出现红色向下箭头和标签,显示相同详情。
无信号:如果市场条件不够强,指标将在图表顶部写出“无有效买入/卖出信号”。
动态止盈/止损:止盈和止损水平会根据波动性和 RSI 条件自动调整。
为了最大化效果,建议在不同时间框架(M1、M5、M15、H1、H4)之间切换,以找到最适合您交易风格的清晰信号。
指标工作原理
Signal Strike 结合了多层分析:
趋势检测。
动量过滤。
波动性检查。
成交量确认。
犹豫过滤——忽略小且弱的蜡烛以避免错误入场。
只有当这些条件同时满足时,指标才会生成买入或卖出信号。这确保每个信号都由多重确认支持,减少噪音,提高准确性。
主要特点(5 大亮点)
清晰的入场、止损和止盈水平——图表上即时可见。
置信度百分比——在入场前了解每个信号的强度。
多时间框架支持——适用于从 M1 到 H4 的所有时间框架。
自动过滤——避免犹豫或低成交量期间的错误信号。
用户友好标签——易于阅读,条件不满足时显示“无信号”。
按时间框架推荐设置
指标包含灵活输入(LookbackCandles、ATRPeriod、ATRMultiplier、SMA 周期、RSI 水平等)。以下是针对不同交易风格的优化设置:
M1(剥头皮)
LookbackCandles:20
ATRPeriod:10
ATRMultiplier:0.4
SMA 快/慢:10 / 30
RSI:12(买入 > 55,卖出 < 45)→ 适合超短剥头皮快速入场。
M5(快速日内)
LookbackCandles:25
ATRPeriod:14
ATRMultiplier:0.5
SMA 快/慢:20 / 50
RSI:14(买入 > 55,卖出 < 45)→ 适合平衡的短线日内交易。
M15(日内波段)
LookbackCandles:30
ATRPeriod:14
ATRMultiplier:0.6
SMA 快/慢:20 / 60
RSI:14(买入 > 56,卖出 < 44)→ 适合捕捉中等日内波动。
H1(波段交易)
LookbackCandles:40
ATRPeriod:20
ATRMultiplier:0.7
SMA 快/慢:30 / 80
RSI:14(买入 > 57,卖出 < 43)→ 适合更高时间框架波段的更强过滤。
H4(持仓交易)
LookbackCandles:50
ATRPeriod:20
ATRMultiplier:0.8
SMA 快/慢:50 / 100
RSI:14(买入 > 58,卖出 < 42)→ 适合长期高置信度入场。
为什么选择 Signal Strike?
Signal Strike 不仅仅是另一个指标——它是一个决策工具,节省时间,减少不确定性,帮助交易者专注于最佳机会。无论您是在 M1 上做剥头皮,还是在 H4 上做波段交易,Signal Strike 都能适应您的风格,提供清晰精准的强力入场信号。
使用 Signal Strike 掌控您的交易,体验自信交易带来的不同。
摘要
When a valid trade setup occurs, Signal Strike plots entry, stop loss, and take profit levels on the chart, each color-coded for clarity: blue for entry, orange for stop loss, and lime green for take profit. BUY signals are marked with green arrows and labels, while SELL signals use red. A confidence percentage accompanies each signal to indicate its strength. If no valid setup is detected, a “No valid BUY/SELL signal” message appears.
The indicator supports multiple timeframes from M1 to H4, with recommended settings optimized for scalping, intraday, swing, and position trading styles. Take profit and stop loss levels adjust dynamically based on volatility and RSI conditions. Signal Strike aims to assist traders in making informed decisions by highlighting clear entry points, risk levels, and profit targets across various markets including Forex, commodities, crypto, and stocks.
客户评价
5 | 50 % | |
4 | 0 % | |
3 | 50 % | |
2 | 0 % | |
1 | 0 % |