说明
Stop Loss Pro 是一个强大且免费的 cTrader 指标,旨在消除风险管理中的猜测。基于先进的市场结构分析,它会自动识别并直接在您的图表上显示最可靠的止损水平。借助此工具,交易者可以自信地保护他们的交易,因为每个建议的水平都基于技术逻辑、成交量动态和波动率过滤器的结合。
工作原理
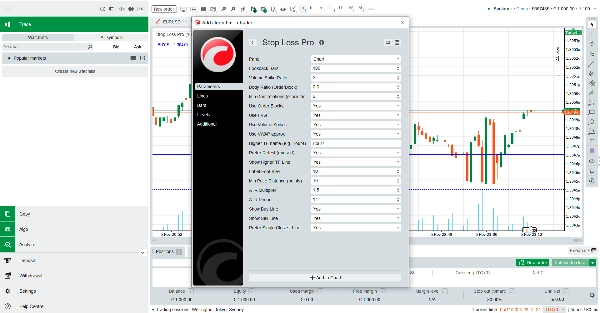
当附加到您的图表时,Stop Loss Pro 会持续扫描最近的价格动作、成交量激增、订单区块形成、公允价值缺口和波动范围。通过这些分析,它计算出买入和卖出情景中最具战略性的止损水平。
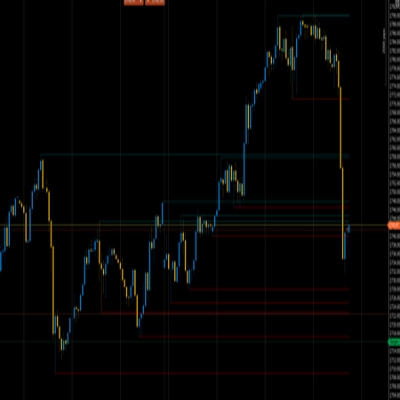
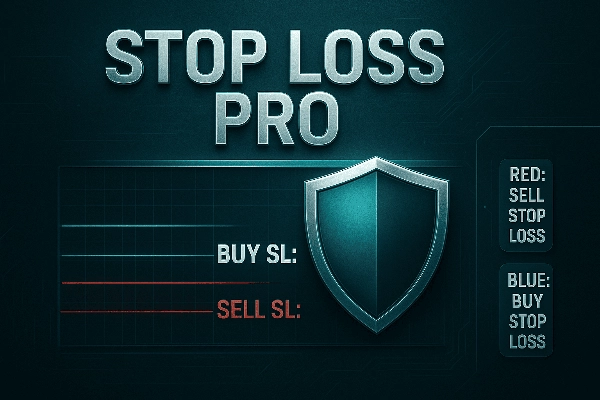
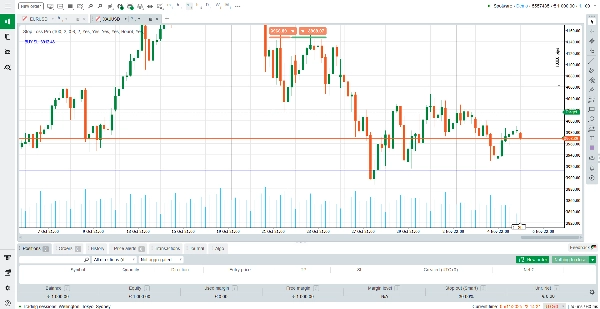
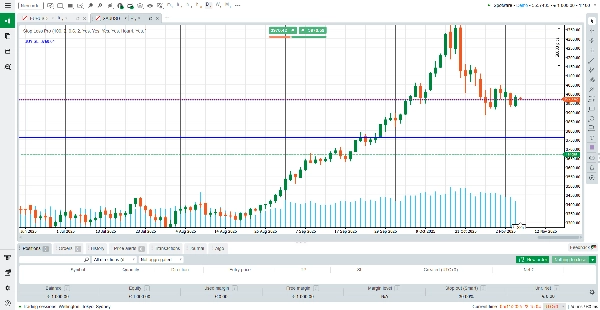
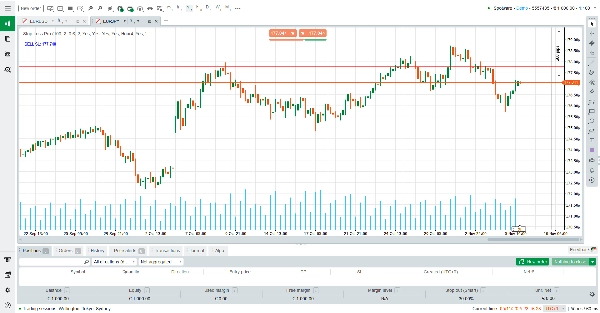
蓝线代表买入交易的推荐止损水平。此线始终位于当前市场价格下方,距离平衡了安全性与效率。
红线代表卖出交易的推荐止损水平。此线始终位于当前市场价格上方,确保空头头寸免受突然反转的影响。
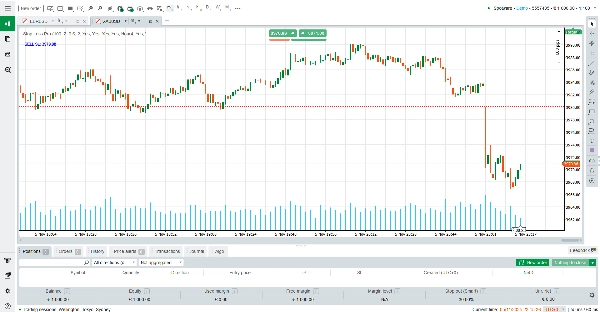
根据您的设置,指标可以同时显示两条线,或仅关注最接近且最相关的单条线。这种灵活性允许交易者根据个人风格调整工具——无论是偏好保守的双线确认,还是简洁的一线清晰。
信息解读
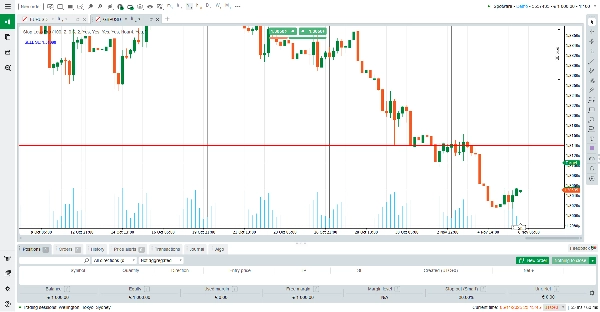
在您的图表左上角,Stop Loss Pro 显示一个清晰的标签,标明当前的止损建议。例如:
“BUY SL: 1.2345” 意味着指标已识别出一个强有力的多头保护水平,位于 1.2345。
“SELL SL: 1.2450” 意味着指标建议在 1.2450 处为空头头寸设置止损。
如果两个信号都有效,指标会突出显示最接近当前市场价格的那个,帮助您快速果断地行动。
重要性
止损位置是交易中最关键的方面之一。止损设置过近,您可能会被市场噪音止损;设置过远,则可能遭受不必要的损失。Stop Loss Pro 通过结合多种确认方法——ATR 波动率过滤器、订单区块检测、成交量分析和 VWAP 近似——解决了这一问题,提供既现实又具保护性的止损水平。
主要特点
双止损线 – 即时查看买入和卖出保护水平,颜色编码以便清晰识别。
智能过滤 – 利用 ATR、成交量激增和订单区块逻辑避免弱或随机的止损水平。
高时间框架感知 – 可选择显示更大时间框架的确认线,增强信心。
灵活显示模式 – 可选择同时显示两条线或仅显示最接近市场的单条线。
免费且易用 – 无隐藏费用,无复杂操作——只需附加到您的图表,即可自信交易。
结语
Stop Loss Pro 不仅仅是一个指标——它是一个帮助您精准管理风险的交易伙伴。无论您是刚开始学习止损重要性的初学者,还是寻求可靠确认工具的经验丰富交易者,这个指标都能带来清晰、纪律和安心。最重要的是,它完全免费供您下载和使用。
今天就用 Stop Loss Pro for cTrader 掌控您的风险管理。
摘要
The tool integrates multiple technical factors such as Average True Range (ATR) volatility filters, volume dynamics, order block detection, and VWAP approximations to provide stop-loss levels that balance protection and efficiency. It also offers optional higher-timeframe confirmations for added reliability. A clear label on the chart indicates the active stop-loss recommendation, aiding quick decision-making.
Stop Loss Professional supports various markets including Forex, indices, commodities, cryptocurrencies, and stocks. It is suitable for different trading styles and strategies such as breakout and scalping. The indicator aims to enhance trade protection by reducing the risk of premature stop-outs or excessive losses through informed stop-loss placement.