说明
流动性压力指数是一款专业级工具,旨在为交易者提供对市场流动性隐藏动态的更深入洞察。不同于仅对价格作出反应的传统振荡器,流动性压力指数将成交量、波动率压缩和方向流合并为一条易于阅读的线。这使其成为希望了解买卖压力是否真正主导蜡烛图背后的交易者的强大助手。
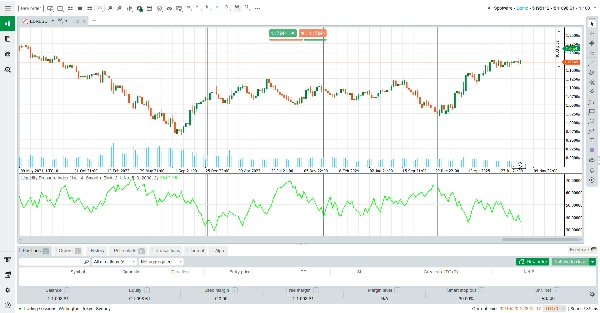
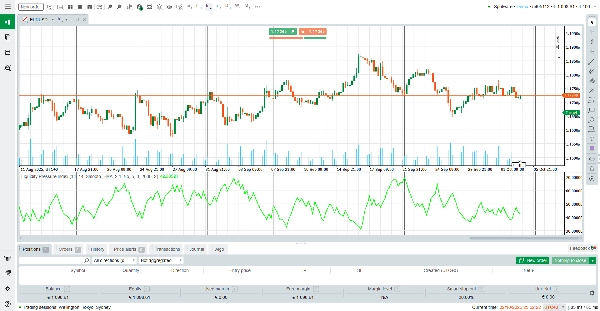
其核心是,ALB计算累计买入流动性与累计卖出流动性之间的平衡,并将结果相对于滚动成交量进行归一化。输出以中性水平50为中心。高于50的值表示买入流动性更强,而低于50的值则显示卖出流动性更强。
这一简单的视觉提示使交易者能够立即判断潜在的订单流,而无需同时解读多个指标。
如何读取指标
线条高于50:市场显示买方流动性更强。这通常支持看涨延续或表示隐藏需求吸收卖单。
线条低于50:市场显示卖方流动性更强。这通常支持看跌延续或表示隐藏供应吸收买单。
平坦或接近50:流动性平衡,表明犹豫不决或盘整。
平滑选项:交易者可以选择EMA或KAMA平滑,以减少噪音并专注于主导的流动性趋势。
工作原理
该指标首先测量真实波动范围(ATR),并将其与实际蜡烛范围进行比较以估计压缩程度。然后将其与成交量结合,区分待执行流动性(订单簿中等待的订单)和已执行流动性(已成交的订单)。根据蜡烛方向,算法分配隐藏的买入或卖出吸收。最后,结果相对于成交量的滚动EMA进行归一化、缩放和平滑处理以提高清晰度。
最终结果是一个动态流动性指数,能够适应市场状况,实时揭示买卖双方的拉锯战。
主要特点
专注流动性洞察:超越价格,揭示隐藏的买卖压力。
自适应平滑:可选择EMA或KAMA以减少噪音。
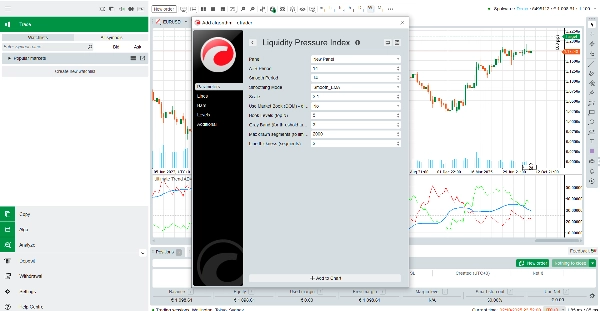
可定制参数:控制ATR周期、平滑长度、缩放和线条粗细。
优化性能:轻量设计,带有分段限制,确保图表平滑。
为什么使用流动性压力指数?
在快速变化的市场中,仅凭价格可能会产生误导。高级流动性平衡为交易者提供更深层的视角,显示市场是否真正由流动性支撑,或走势是否在弱参与下运行。无论您是寻找短期失衡的剥头皮交易者,还是确认趋势强度的波段交易者,流动性压力指数都提供了专业级的流动性视角——最重要的是,它完全免费。
今天就下载它,为您的交易决策增添新的清晰维度。
摘要
客户评价
5 | 0 % | |
4 | 100 % | |
3 | 0 % | |
2 | 0 % | |
1 | 0 % |