
Daily Open Color Zones
指标
344 下载
版本 1.0, Sep 2025
Windows 版、Mac 版
4.0
评价:1
说明
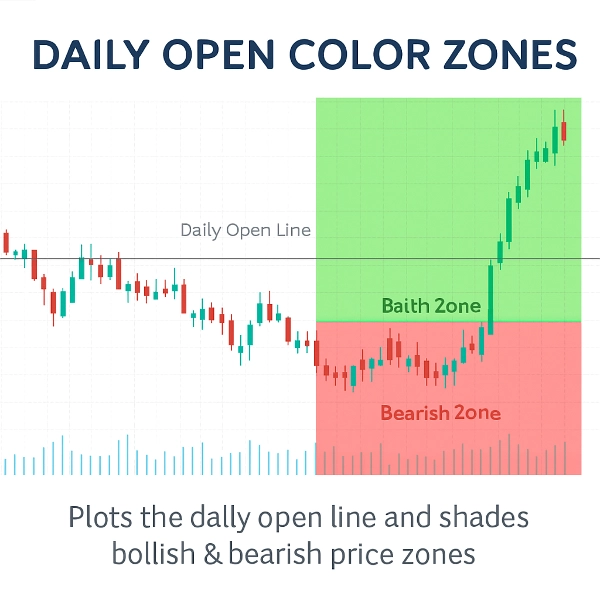
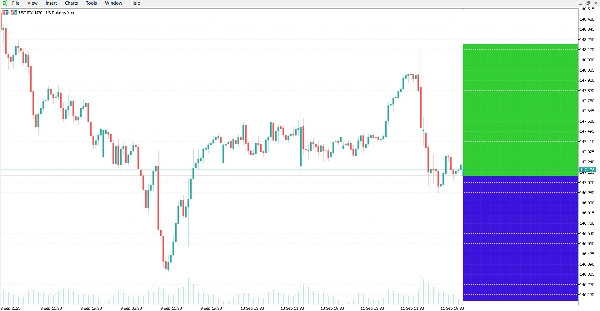
该指标绘制每日开盘线并阴影显示其周围的多头和空头价格区域。
它提供了一个清晰的视觉参考,以查看市场是在每日开盘价之上还是之下交易,这在日内分析中是一个常用的水平。
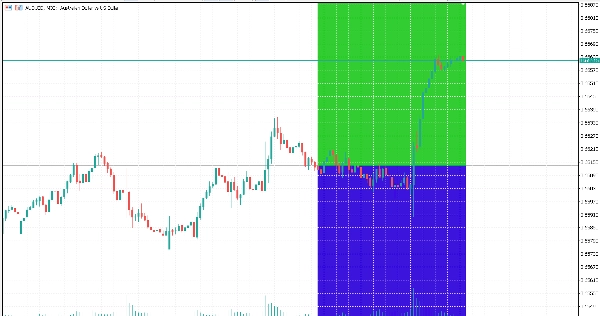
该指标自动在每日开盘价处绘制一条水平线,并突出显示图表区域:
- 线以上的绿色区域(多头区域)。
- 线以下的红色区域(空头区域)。
功能:
- 自动每日开盘线:精确绘制每日开盘价。
- 颜色区域:通过可自定义颜色轻松区分多头和空头区域。
- 动态更新:区域随每根新蜡烛自动调整。
- 可自定义外观:线条样式、粗细和区域颜色均可修改。
- 轻量高效:设计以最小化CPU使用率。
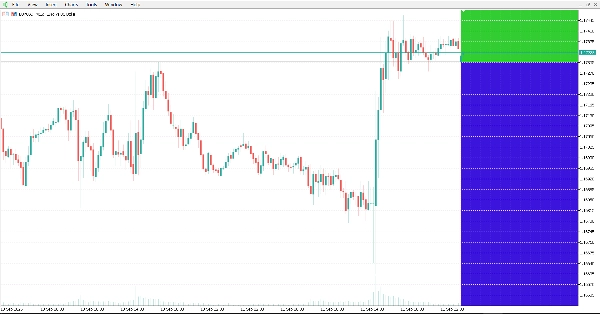
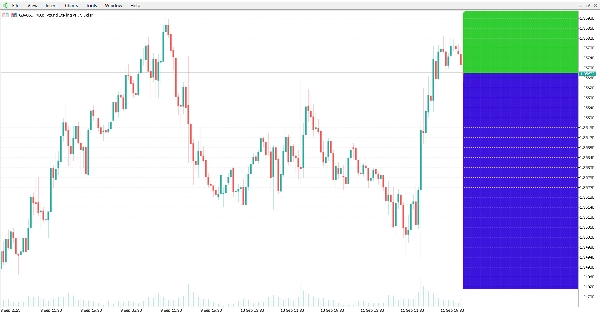
- 适用于所有符号和时间框架。
结论:
该指标提供了每日开盘价及相关多头/空头区域的清晰图表可视化。它可应用于不同市场和时间框架的技术分析。
摘要
AI 摘要
The Daily Open Color Zones indicator visually marks the daily open price on trading charts by automatically plotting a horizontal line at this level. It shades the price area above the daily open line in green to indicate bullish zones and the area below in red to indicate bearish zones. These color-coded zones update dynamically with each new candle, providing real-time visual cues about market direction relative to the daily open. The indicator supports all symbols and timeframes, making it applicable across various markets including Forex, cryptocurrencies, and commodities like gold (XAUUSD). Users can customize the line style, thickness, and zone colors to suit their preferences. Designed to be lightweight, it minimizes CPU usage while offering clear intraday reference points commonly used in technical analysis and scalping strategies.
指标配置
客户评价
4.0
评价:1
5 | 0 % | |
4 | 100 % | |
3 | 0 % | |
2 | 0 % | |
1 | 0 % |
客户评价
October 20, 2025
Clean and visual 🎨 - Daily Open Zones make trend bias crystal clear. Great tool for intraday planning and momentum entries!
讨论
常见问答
Forex
Scalping
EURUSD
Crypto
Grid
XAUUSD
cTrader Store 提供的所有产品,包括交易机器人、指标和插件,均由第三方开发者提供,仅供信息参考和技术访问之用。cTrader Store 并非经纪商,不提供投资建议、个人推荐或任何未来业绩保证。
该作者的其他作品


猜您喜欢


价格
注册日期 13/09/2025
27
销售
5.37K
免费安装