
Free Smart Money Concepts (SMC) from TradingView
指标
3.25K 下载
版本 1.0, Oct 2025
Windows 版、Mac 版
5.0
评价:8
说明
- 🔷 什么是智能资金概念(SMC)?
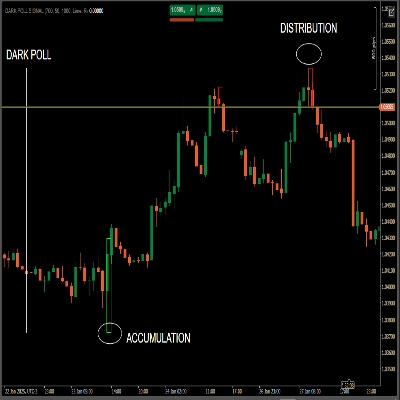
- SMC 是一个价格行为框架,专注于机构“智能资金”如何积累和分配头寸。
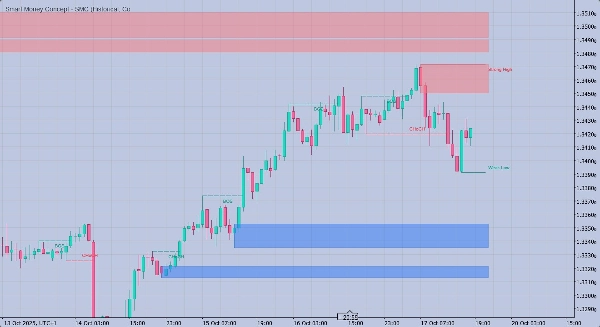
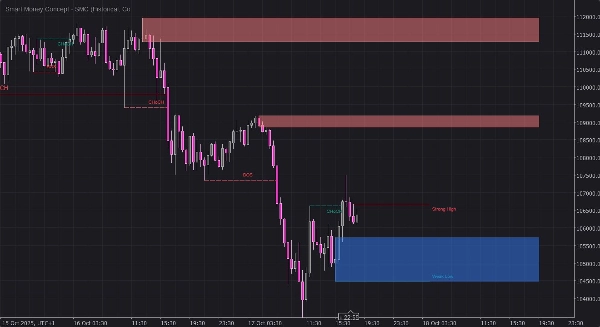
- 它用 市场结构(BOS/CHoCH)、流动性(EQH/EQL)、订单区块(OB)、公平价值缺口(FVG)和溢价/折扣区的逻辑地图替代基本模式,以预测可能的延续或反转。
- 🚀 该指标的功能
- 检测 结构突破(BOS)和特征变化(CHoCH),涵盖波段和内部结构。
- 绘制 订单区块(OB)和公平价值缺口(FVG)为半透明区域(RGBA颜色—不透明度完全由用户控制)。
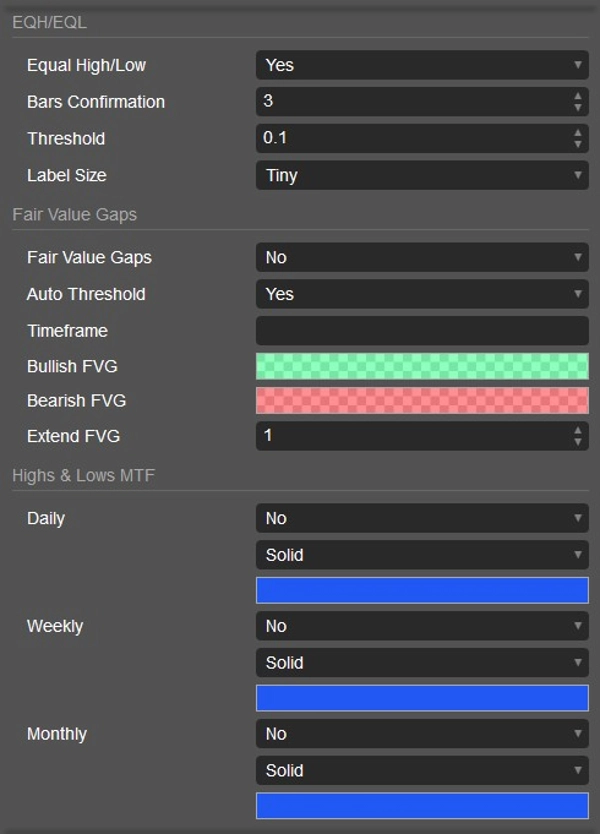
- 标记 等高/等低(EQH/EQL)以显示流动性池。
- 标注 强/弱高点/低点,让您了解哪一方可能成为目标或被保护。
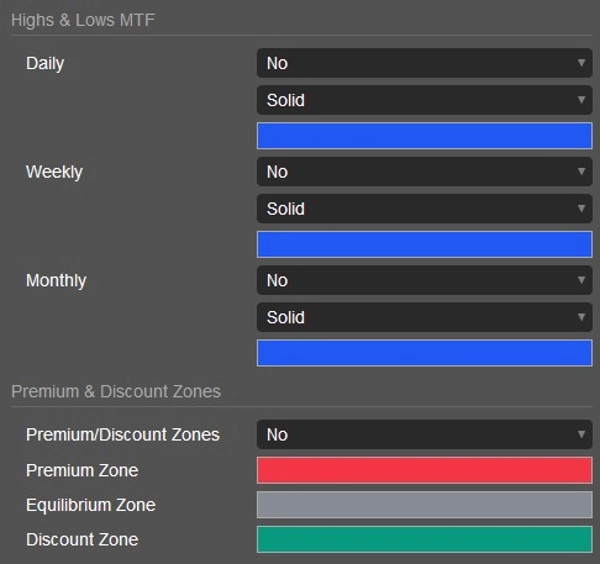
- 绘制 溢价/均衡/折扣区间,覆盖当前波段范围,提供价值区域背景。
- 叠加 日/周/月高低点,实现多时间框架的汇聚。
- 提供 当前/历史绘图模式和单色/彩色样式。
- 🧭 如何使用(实用工作流程)
- 1)先读取结构:
-
- 在波段和内部级别寻找 BOS/CHoCH 以确定偏向。
- 看涨的 BOS + 内部 BOS 通常预示延续;CHoCH 则警示潜在反转。
- 2)绘制不平衡和区块:
-
- 使用 FVG 作为价格常回补的“效率目标”。
- 使用 OB 作为可能形成入场点的缓解区(例如限价或确认入场)。
- 3)与流动性对齐:
-
- 关注 EQH/EQL 的流动性扫荡;扫荡 + BOS 是强有力的 SMC 叙事。
- 注意 强/弱高点/低点,以判断哪一方更脆弱。
- 4)添加汇聚:
-
- 检查 溢价/折扣:折扣区买入设置概率更高;溢价区卖出设置概率更高。
- 添加 多时间框架级别(日/周/月)和您自己的交易时段以提高精准度。
- 5)执行和管理:
-
- 入场:OB 缓解或 FVG 填补,配合结构对齐。
- 止损:设在 OB/FVG 失效点之外或最近的强支点外。
- 目标:对面流动性、相对的 OB/FVG 或波段均衡点。
- ⚙️ 您控制的关键设置
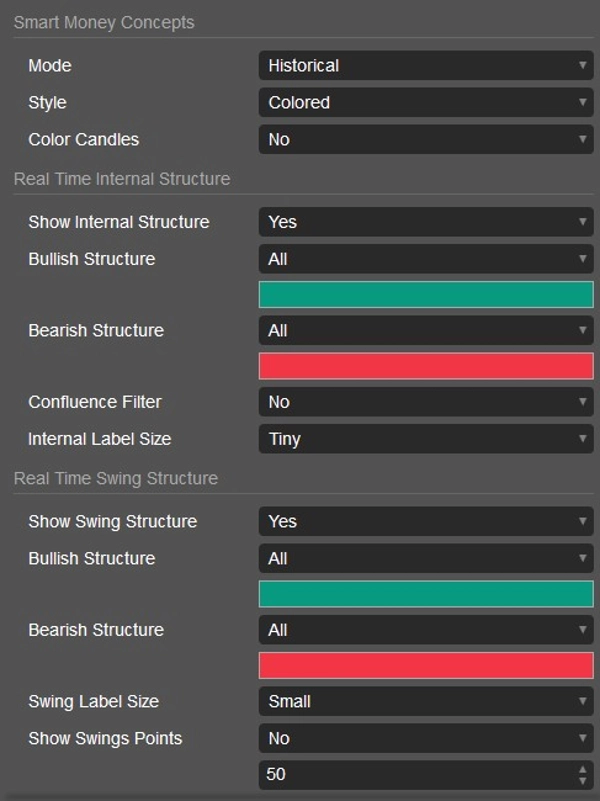
- 模式: 历史与当前(干净的实时视图)。
- 结构过滤器: 显示波段与内部的 BOS/CHoCH;标签大小;可选汇聚(影线逻辑)。
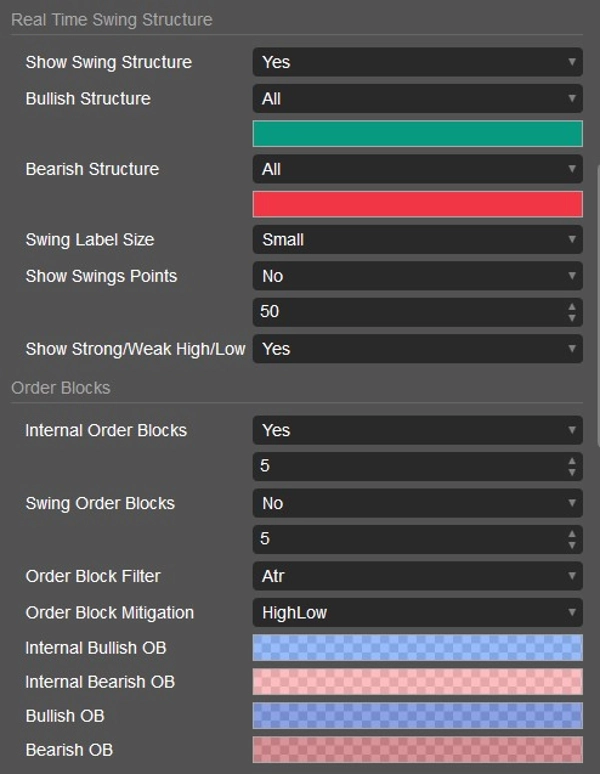
- OB/FVG 颜色: 选择任意 RGBA 颜色;alpha 通道直接设置透明度。
- 计数/限制: 最大可见 OB 数量;FVG 扩展;EQH/EQL 灵敏度。
- 多时间框架级别: 切换日/周/月并选择线条样式。
- 样式: 彩色或单色,外加按趋势的可选蜡烛着色。
- 🧩 交易者喜欢它的原因
- 1:1 对等逻辑,与流行的 TradingView SMC 方法(BOS/CHoCH,OB/FVG 对等)一致。
- 清晰的视觉效果:区域和标签保持可读,实时平滑更新。
- 灵活:适用于剥头皮到波段交易,支持 cTrader 的任何符号或时间框架。
- ✅ 最佳实践
- 将 SMC 背景与 风险管理 和明确的操作手册(入场、止损、目标规则)结合使用。
- 围绕高时间框架级别和交易时段开盘使用 提醒或观察列表,以获得更高质量的行情。
- 始终结合 市场时段 和 新闻日历进行验证,以避免随机波动。
- 📌 注意事项
- 视觉效果依赖于经纪商数据(买卖报价/交易时段可能有所不同)。
- 此工具 不构成财务建议;交易存在风险。请先在模拟账户中使用,切勿直接实盘操作。
摘要
AI 摘要
Free Smart Money Concepts (SMC) indicator for cTrader replicates the TradingView SMC framework, focusing on institutional price action analysis. It identifies key market structure elements such as Break of Structure (BOS) and Change of Character (CHoCH) on both swing and internal levels to help establish trading bias. The indicator visually marks Order Blocks (OB) and Fair Value Gaps (FVG) as semi-transparent zones, highlighting potential entry and mitigation areas. It also detects Equal Highs/Lows (EQH/EQL) to indicate liquidity pools, and labels strong or weak highs and lows to assess market vulnerability.
Additional features include plotting premium, equilibrium, and discount zones within the current swing range for value-area context, and overlaying daily, weekly, and monthly highs and lows for multi-timeframe confluence. Users can customize drawing modes (present or historical), color schemes (monochrome or colored), and opacity levels for OB/FVG zones. The indicator supports flexible use across all symbols and timeframes available in cTrader, suitable for scalping to swing trading.
The workflow involves reading market structure, mapping imbalances and blocks, aligning with liquidity, adding confluence from premium/discount zones and multi-timeframe levels, and executing trades with defined entry, stop, and target rules. Visuals depend on broker data feeds. This tool is intended for analysis and does not provide financial advice.
指标配置
客户评价
5.0
评价:8
5 | 100 % | |
4 | 0 % | |
3 | 0 % | |
2 | 0 % | |
1 | 0 % |
客户评价
July 6, 2026
May 23, 2026
March 4, 2026
December 11, 2025
November 4, 2025
Superfantastic 3 in one zones, one of the best indicators on here ,and for free. If you cant figure it out after this, you got something wrong with ya :). Nicely done my friend, how did you code it C# or python?
讨论
常见问答
BTCUSD
Forex
Signal
Breakout
Indices
EURUSD
Commodities
GBPUSD
NZDUSD
Fibonacci
Prop
ZigZag
Scalping
Fair Value Gap
SMC
Crypto
Stocks
XAUUSD
NAS100
ATR
USDJPY
cTrader Store 提供的所有产品,包括交易机器人、指标和插件,均由第三方开发者提供,仅供信息参考和技术访问之用。cTrader Store 并非经纪商,不提供投资建议、个人推荐或任何未来业绩保证。
该作者的其他作品


猜您喜欢


价格
46
销售
3.97K
免费安装