
ICT Order Block
指标
709 下载
版本 1.0, Nov 2025
Windows 版、Mac 版
3.5
评价:2
说明
ICT 订单区块 - 机构订单区块
自动识别图表上的机构订单区块。可视化价格可能反应的关键区域。
功能介绍
✅ 识别看涨区块(机构买入区) ✅ 识别看跌区块(机构卖出区) ✅ 在重要区域显示彩色矩形 ✅ 当价格突破区块时,区块消失
使用方法
简单安装
- 下载指标
- 在 cTrader 图表中添加
- 完成!您将自动看到区块
配置
主要设置
- 显示 SCOB:显示或隐藏区块
- 缓解方法:
-
- 收盘价:蜡烛收盘时区块消失
- 影线:触及时区块消失
- 显示最近 X 个 SCOB:显示多少区块(1-15)
- 应用波动率过滤器:根据波动率过滤区块
颜色
- 看涨颜色:看涨区块颜色(默认浅绿色)
- 看跌颜色:看跌区块颜色(默认红色)
- 使用颜色选择器调整透明度
解读
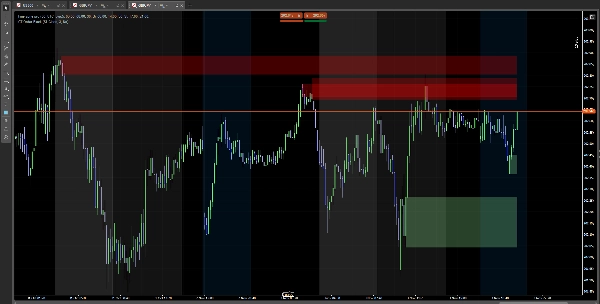
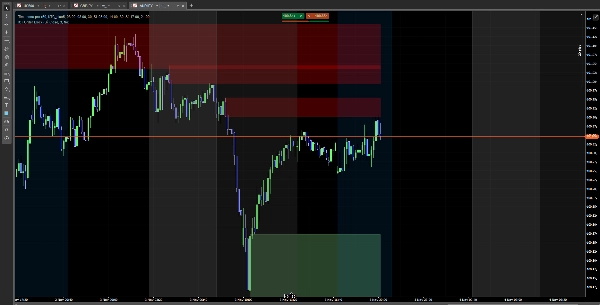
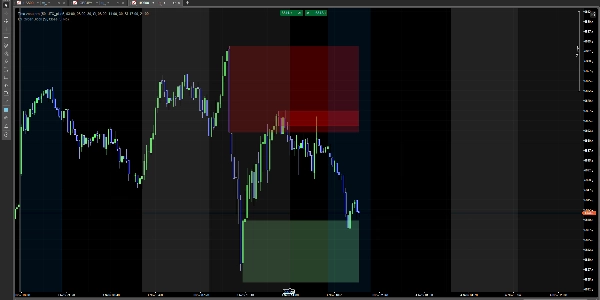
🟢 绿色区块(看涨):潜在支撑区 🔴 红色区块(看跌):潜在阻力区
注意:这是一个技术分析指标。请配合适当的风险管理使用。
摘要
AI 摘要
ICT Order Block is a technical analysis indicator designed for use on cTrader charts. It automatically identifies institutional order blocks, highlighting key price zones where market reactions may occur. The indicator detects bullish order blocks (potential institutional buying zones) and bearish order blocks (potential institutional selling zones), displaying them as colored rectangles—green for bullish support areas and red for bearish resistance areas. These blocks visually represent important supply and demand zones that traders can monitor.
Key features include automatic block detection, configurable display options such as the number of blocks shown (1–15), and a volatility filter to refine block selection. Users can choose how blocks disappear: either when a candle closes beyond the block or when the block is touched by price wicks. Color customization and transparency adjustments are also available for better chart integration.
Installation involves adding the indicator to a cTrader chart, after which the blocks appear automatically. This tool supports analysis across Forex, Indices, and Cryptocurrency markets. It serves as a visual aid for identifying potential support and resistance zones based on institutional trading activity and should be used alongside proper risk management practices.
指标配置
客户评价
3.5
评价:2
5 | 50 % | |
4 | 0 % | |
3 | 0 % | |
2 | 50 % | |
1 | 0 % |
客户评价
January 27, 2026
the zones are blocking the candles, zones need to be behind the candles .other than that it is good
讨论
常见问答
Forex
Indices
Crypto
cTrader Store 提供的所有产品,包括交易机器人、指标和插件,均由第三方开发者提供,仅供信息参考和技术访问之用。cTrader Store 并非经纪商,不提供投资建议、个人推荐或任何未来业绩保证。


价格
注册日期 24/02/2025
15
销售
1.83K
免费安装