
说明
内在递归价值指标
概述
内在递归价值是一种自定义指标,利用多个周期的递归相对强度计算来识别内在市场趋势。它确定趋势强度达到关键水平的关键价格点,提供潜在反转和趋势确认的见解。内在递归价值的概念基于市场动量和趋势强度可以通过多层价格行为分析递归细化的思想。这种递归方法有助于识别传统基于价格的指标可能忽略的深层多头和空头条件。
多头和空头交易区
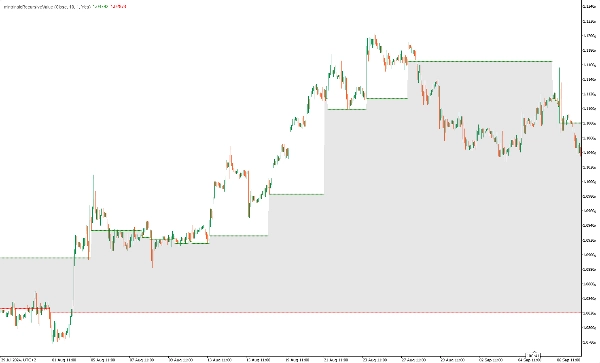
- 多头交易区:当内在递归价值确认持续的多头强度时形成该区域。它发生在所有递归相对强度计算均显示持续高于均衡值,表明强劲的上行动能。多头交易区帮助交易者识别潜在的多头入场点和价格可能继续上涨的动态支撑区域。
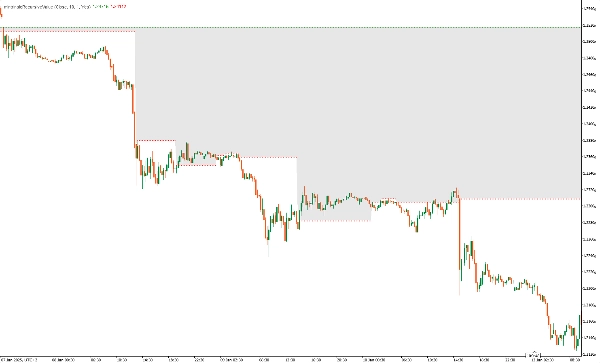
- 空头交易区:当内在递归价值识别持续的空头强度时建立该区域。当所有递归相对强度值低于均衡值时,表明持续的下跌趋势,为交易者提供空头入场机会并定义价格可能继续下跌的动态阻力水平。
指标输出
- outIntrinsicRecursiveLong :当检测到多头强度时显示内在多头水平。
- outIntrinsicRecursiveShort:当检测到空头强度时显示内在空头水平。
使用方法
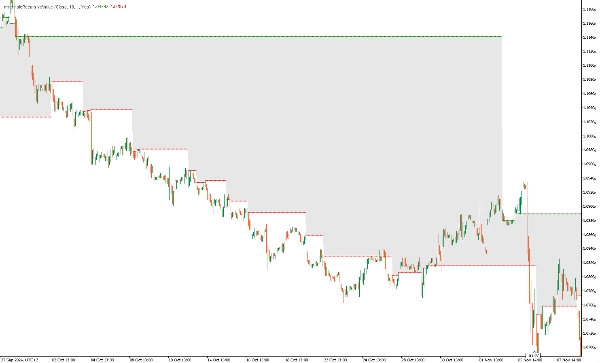
- 趋势确认:当所有相对强度周期一致时,有助于识别强劲的多头或空头趋势。
- 反转检测:当内在价值发生变化时,发出潜在转折点信号。
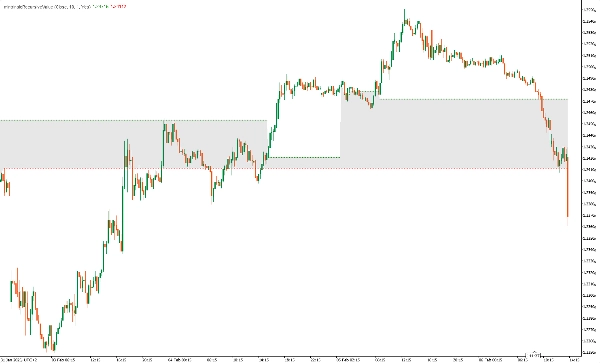
- 支撑与阻力水平:内在价值作为动态支撑和阻力水平。
示例交易策略
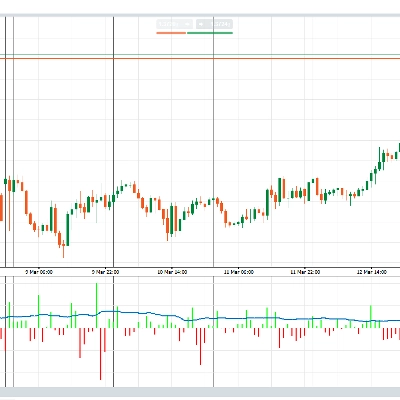
- 多头入场:当建立内在多头水平且价格行为确认多头动能时入场,这意味着价格高于均衡值(指标绿色部分)。
- 空头入场:当建立内在空头水平且价格行为确认空头动能时入场,这意味着价格低于均衡值(指标红色部分)。
- 退出策略:使用移动止损或内在水平消失时退出交易。
注意事项
- 该指标设计用于趋势跟踪策略,在趋势市场中效果最佳。
- 它可以与其他指标结合使用,如动量指标,以触发交易确认。
结论
内在递归价值指标是一个强大的工具,适合希望通过递归相对强度计算增强趋势分析的交易者。通过识别高概率趋势的关键价格水平,该指标为市场方向和潜在交易机会提供了宝贵的见解。
摘要
指标配置
客户评价
0.0
评价:0
客户评价
该产品尚无评价。已经试过了?抢先告诉其他人!
讨论
常见问答
cTrader Store 提供的所有产品,包括交易机器人、指标和插件,均由第三方开发者提供,仅供信息参考和技术访问之用。cTrader Store 并非经纪商,不提供投资建议、个人推荐或任何未来业绩保证。


价格
154
免费安装