
GUPPY-MASTER V3
指标
250 下载
版本 1.0, Mar 2026
Windows 版、Mac 版
5.0
评价:3
说明
GUPPY 趋势大师 V3(4X4 交易技术)
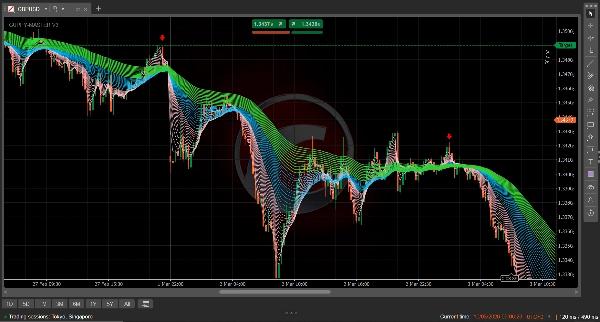
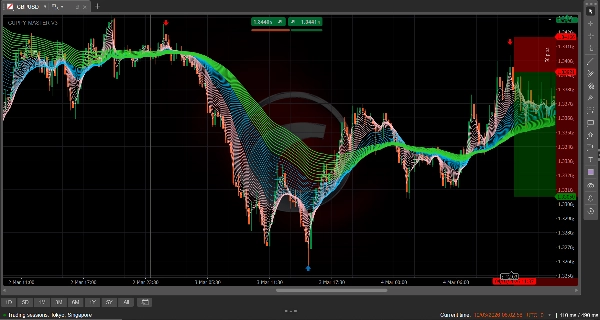
用38-EMA彩虹图可视化市场情绪
Guppy 趋势大师 4X4 是 cTrader 的高级技术分析工具,将复杂的价格行为转化为清晰的、颜色编码的市场心理地图。通过同时绘制38条指数移动平均线(EMA),它使交易者能够区分暂时的“噪音”和真正的趋势反转。
4X4 可视逻辑
该指标将市场数据组织成三个不同的“带状”结构,为您提供趋势的多维视角:
- 粉色带(周期 2–15):“投机者”组。这些线代表短期交易者。当它们展开时,动能强劲。当它们收缩时,行情即将疲软。
- 蓝色带(周期 17–41):“桥梁”组。它作为关键的过渡区,通常是强势趋势中重新入场的“反弹”区域。
- 绿色带(周期 44–74):“投资者”组。代表长期情绪。宽广且展开的绿色带表示强大且稳定的趋势,难以被打破。
为什么使用该指标?
- 即时趋势确认:一目了然市场是趋势还是盘整。如果带状线纠缠在一起,则保持观望。如果它们展开且分离,趋势强劲。
- 精准剥头皮区域:专为 M1 和 M5 时间框架优化,4X4 精准标示“逢低买入”和“逢高卖出”区域。
- 波动性可视化:带状线之间的“间隙”显示了行情背后的信心程度。“清晰的间隙”(如4X4逻辑所示)表示高概率交易环境。
- 无滞后逻辑:通过使用指数移动平均线(EMA),4X4 对价格变化的反应比基于简单移动平均线(SMA)的 Guppy 指标更快,更适合现代高频市场。
如何解读信号
- 看涨力量:粉色在顶部,其次是蓝色,绿色在底部。所有组别向上展开,线间有明显间隙。
- 看跌力量:绿色在顶部,其次是蓝色,粉色在底部。所有组别向下展开。
- 挤压:当所有三个组别汇聚于一点时,意味着即将发生大规模突破。
摘要
AI 摘要
The GUPPY TREND MASTER V3 is a technical analysis indicator designed for the cTrader platform that visualizes market sentiment using 38 Exponential Moving Averages (EMAs). It organizes these EMAs into three color-coded ribbons to provide a multi-dimensional view of market trends: the Pink Ribbon (periods 2–15) reflects short-term speculator activity, the Blue Ribbon (periods 17–41) serves as a transitional bridge zone, and the Green Ribbon (periods 44–74) indicates long-term investor sentiment. This structure helps traders distinguish between market noise and genuine trend reversals.
Key features include instant trend confirmation by observing ribbon separation or entanglement, precision scalping zones optimized for 1- and 5-minute timeframes, and visualization of market volatility through the spacing between ribbons. The use of EMAs ensures faster reaction to price changes compared to traditional SMA-based Guppy indicators, supporting high-frequency trading environments.
Signal interpretation is based on ribbon positioning and spacing: bullish trends show Pink above Blue above Green with upward fanning, bearish trends show the reverse with downward fanning, and convergence of all ribbons signals an imminent breakout. The indicator supports various markets including forex pairs (GBPUSD, USDJPY), cryptocurrencies, stocks, and commodities like gold (XAUUSD).
指标配置
客户评价
5.0
评价:3
5 | 100 % | |
4 | 0 % | |
3 | 0 % | |
2 | 0 % | |
1 | 0 % |
客户评价
March 29, 2026
This is a nice indicator 😀. Overall the images are what is represented on the chart no faking. But only the arrows missing. Let me hope version 2 has them.
March 17, 2026
Very good 👍👍 indicator. Have looked for it every where finally I found it works every well
讨论
常见问答
Signal
Breakout
Scalping
GBPUSD
Crypto
Stocks
XAUUSD
NAS100
USDJPY
cTrader Store 提供的所有产品,包括交易机器人、指标和插件,均由第三方开发者提供,仅供信息参考和技术访问之用。cTrader Store 并非经纪商,不提供投资建议、个人推荐或任何未来业绩保证。
该作者的其他作品


价格
注册日期 27/02/2026
33.16K
交易量
25.96K
盈利点数
8
销售
389
免费安装