

RSI Velocity Gauge
指标
102 下载
版本 1.0, May 2026
Windows 版、Mac 版
4.5
评价:2

注册日期 27/02/2026
33.16K
交易量
25.96K
盈利点数
10
销售
510
免费安装
说明
免费提供
🏎️ RSI 速度计专业版 📊
cTrader 的终极实时动量 HUD 和趋势可视化工具
用 RSI 速度计专业版 改变您观察市场动量的方式。告别杂乱无章、分离的振荡器子窗口。这个高级指标将一个时尚的机械仪表盘直接叠加在您的图表上,实时提供市场速度、强度和疲劳点的高保真读数。
采用先进的三角函数用户界面缩放和实时图表绘制逻辑设计,这不仅仅是一个指标——它是您交易布局的完整执行控制中心。
⚡ 主要功能
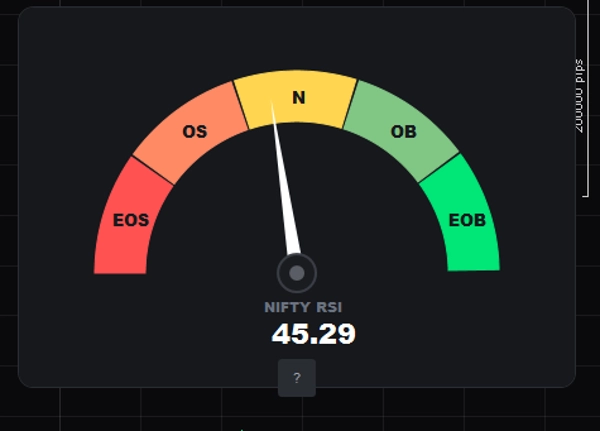
- 🧭 动态机械仪表盘: 一个惊艳的暗模式径向速度计,实时跟踪每一个价格变动的相对强弱指数(RSI)。
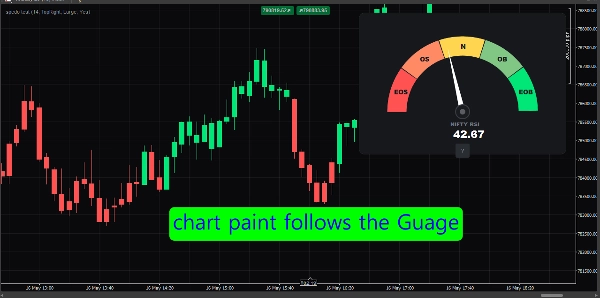
- 🎨 心理学正确的颜色编码: 完美反转以匹配实时市场压力。左侧代表压倒性的卖方控制(红色/橙色),右侧显示激进的买方速度(绿色/薄荷色)。
- 🕯️ 智能蜡烛绘制: 让您的目光锁定价格走势。指标在看涨动量(RSI > 50)时自动将图表蜡烛涂成绿色,在看跌环境(RSI < 50)时涂成红色。
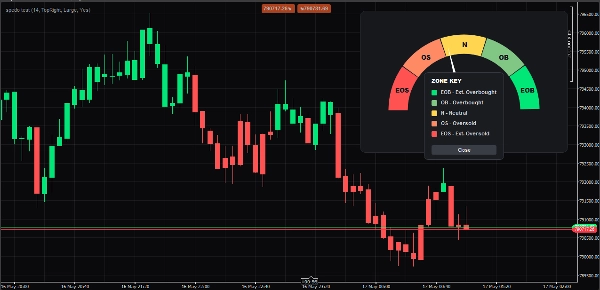
- 🧠 交互式弹出图例(
?按钮): 保持您的图表简洁且极简。点击交互式圆形?按钮,立即切换一个优雅的高亮区域键,详细说明确切的缩写及其对应颜色。 - 📐 完全响应式用户界面缩放: 可选择 小、中、大 视图。指标动态计算所有几何形状、字体大小、边距和边框半径,以完美适应任何显示器分辨率(包括 4K)。
- 📍 灵活的角落定位: 轻松将仪表移出关键价格动作区域。可在左上、右上、左下或右下之间切换,并自动调整内边距。
- 🎛️ 原生颜色选择器: 无需繁琐的十六进制代码!使用 cTrader 无缝下拉颜色网格自定义所有 5 个区域和趋势蜡烛的颜色。
🔍 区域图例键
点击仪表盘上的内联 ? 按钮查看您的自定义区域规则:
- 🟥 EOS(极度超卖 | 0–20): 最大卖出疲劳。潜在反转区域。
- 🟧 OS(超卖 | 20–40): 强烈的看跌动量。空头牢牢掌控。
- 🟨 N(中性 | 40–60): 市场均衡区。横盘或整合走势。
- 🟩 OB(超买 | 60–80): 强烈的看涨动量。多头牢牢掌控。
- 🟩 EOB(极度超买 | 80–100): 最大买入疲劳。潜在回调区域。
⚙️ 可自定义参数
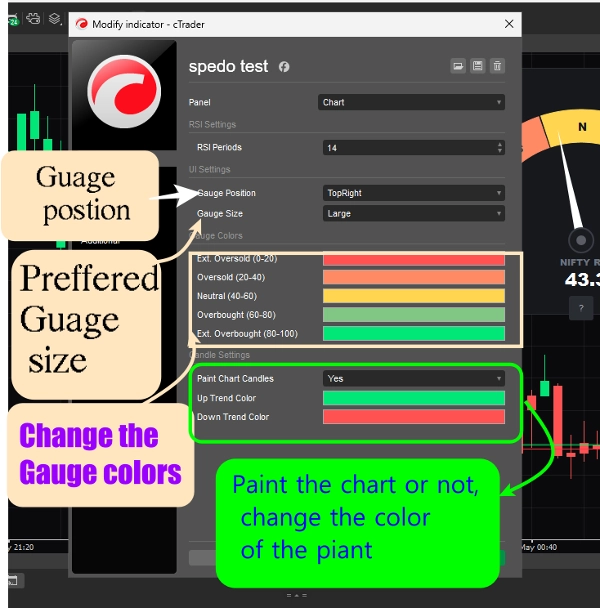
- RSI 设置: 轻松调整计算周期(默认:14)。
- 用户界面定位: 下拉布局选择器(左上、右上、左下、右下)。
- 用户界面大小: 无缝响应缩放器(小、中、大)。
- 仪表颜色: 为所有 5 个动量区独立选择调色板。
- 蜡烛设置: 全局开关以启用/禁用背景蜡烛绘制,配备自定义的上涨和下跌趋势画笔选择器。
摘要
AI summary
The RSI Velocity Gauge is a momentum indicator designed for cTrader that overlays a dynamic, mechanical-style dashboard directly on trading charts. It provides real-time tracking of the Relative Strength Index (RSI) on every tick, visualized as a radial speedometer with color-coded zones indicating market momentum and pressure. The gauge uses a dark-mode interface with colors representing seller dominance (red/orange) and buyer dominance (green/mint).
Key features include automatic candle coloring to reflect bullish (green) or bearish (red) momentum based on RSI values, an interactive pop-up legend explaining zone meanings, and fully responsive UI scaling with adjustable sizes (small, medium, large) and corner positioning options. Users can customize RSI calculation periods, gauge colors for five momentum bands, and toggle candle painting on or off.
The indicator divides RSI values into five zones: Extreme Oversold (0–20), Oversold (20–40), Neutral (40–60), Overbought (60–80), and Extreme Overbought (80–100), helping identify potential reversal or exhaustion points. The RSI Velocity Gauge serves as a comprehensive momentum visualization tool, integrating smoothly into trading layouts for enhanced market speed, strength, and trend analysis.
Key features include automatic candle coloring to reflect bullish (green) or bearish (red) momentum based on RSI values, an interactive pop-up legend explaining zone meanings, and fully responsive UI scaling with adjustable sizes (small, medium, large) and corner positioning options. Users can customize RSI calculation periods, gauge colors for five momentum bands, and toggle candle painting on or off.
The indicator divides RSI values into five zones: Extreme Oversold (0–20), Oversold (20–40), Neutral (40–60), Overbought (60–80), and Extreme Overbought (80–100), helping identify potential reversal or exhaustion points. The RSI Velocity Gauge serves as a comprehensive momentum visualization tool, integrating smoothly into trading layouts for enhanced market speed, strength, and trend analysis.
指标配置
指标分类
动量
输出类型
可视化
过滤器
信号
数据要求
仅 K 线
跳动点数据
交易量
市场深度
外部数据
支持的信号
波动性
趋势强度
突破水平位
触及水平位
反转
交叉
背离
突破
客户评价
4.5
评价:2
5 | 50 % | |
4 | 50 % | |
3 | 0 % | |
2 | 0 % | |
1 | 0 % |
客户评价
September 10, 2026
RSI Velocity Gauge provides a clear radial RSI HUD, accurate zone mapping, candle coloring and a useful interactive legend. Testing on EURUSD and XAUUSD worked well across M1–D1. The main issue is the incorrect hard-coded “NIFTY RSI” label shown on other symbols; live per-tick updating was not independently verified.
讨论
常见问答
RSI
AI-assisted
Moving Average
cTrader Store 提供的所有产品,包括交易机器人、指标和插件,均由第三方开发者提供,仅供信息参考和技术访问之用。cTrader Store 并非经纪商,不提供投资建议、个人推荐或任何未来业绩保证。
该作者的其他作品
















!["[Hamster-Coder] Moving Average MTF" 标识](https://cdn.ctrader.com/image/webp/b11b98b1-194d-4b8e-b00e-d611826ad159_31226)






价格
注册日期 27/02/2026
33.16K
交易量
25.96K
盈利点数
10
销售
510
免费安装