
IR Slowing Moving
指标
165 下载
版本 1.0, Jan 2025
Windows 版、Mac 版
5.0
评价:1
说明
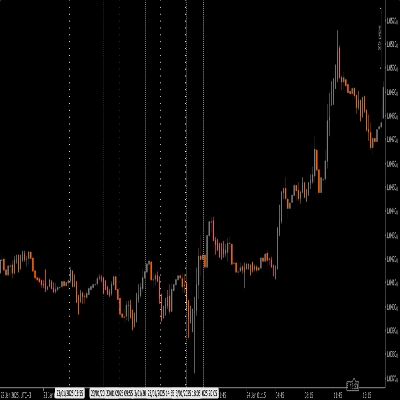
将放缓添加到 IR 移动平均线。
摘要
AI 摘要
IR Slowing Moving is a trading indicator that enhances the IR Moving Average by adding a slowing component. This modification aims to smooth the moving average calculation, potentially reducing noise and improving trend identification. The indicator is designed for use within trading platforms that support custom indicators, providing traders with an adjusted moving average tool to assist in market analysis.
指标配置
客户评价
5.0
评价:1
5 | 100 % | |
4 | 0 % | |
3 | 0 % | |
2 | 0 % | |
1 | 0 % |
客户评价
August 18, 2025
Smooths market noise, customizable, stable performance. Cons: No alerts, lags on low TFs, lacks visual trend highlighting.
讨论
常见问答
cTrader Store 提供的所有产品,包括交易机器人、指标和插件,均由第三方开发者提供,仅供信息参考和技术访问之用。cTrader Store 并非经纪商,不提供投资建议、个人推荐或任何未来业绩保证。


!["[Stellar Strategies] Ultimate Trend & Momentum Dashboard" 标识](https://cdn.ctrader.com/image/webp/e9a9c9e9-4b6c-4bc0-9988-4c4768a23b6c_30290)


价格
5.19K
免费安装