present
注册即可在首次购物时获得 $50 优惠
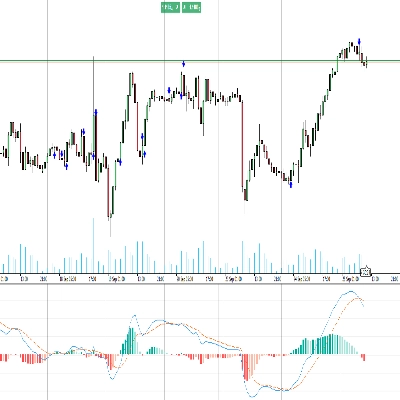
Trading product for IR Macd + MacdLine 指标 MACD, image 1
IR Macd + MacdLine
5.0
评价:2
5.63K
免费安装

说明

一些用户添加了移动平均线到macd以便更好地观察。

在ctrader 4.3.11中,这方面存在一个问题。

我为这些用户制作了一个带有macd线的macd。

摘要

AI 摘要
IR Macd + MacdLine is a technical indicator designed for use on the cTrader platform. It enhances the traditional MACD (Moving Average Convergence Divergence) by incorporating a MACD line, addressing issues found in cTrader version 4.3.11 related to adding moving averages to the MACD. This indicator aims to provide clearer visualization of MACD signals by combining the MACD histogram with an additional MACD line, facilitating better momentum analysis. It is categorized under momentum indicators and supports analysis based on MACD histogram and moving average convergence divergence concepts.
指标配置

讨论

客户评价

5.0
评价:2
5
100 %
4
0 %
3
0 %
2
0 %
1
0 %
客户评价
August 12, 2025
Pros: Clear MACD visualization with extra signal line, customizable, stable. Cons: No alerts, no MTF mode, no auto-signal marking.
April 17, 2025
MACD指标写的比较有特色

常见问答

MACD
cTrader Store 提供的所有产品,包括交易机器人、指标和插件,均由第三方开发者提供,仅供信息参考和技术访问之用。cTrader Store 并非经纪商,不提供投资建议、个人推荐或任何未来业绩保证。


该作者的其他作品

with this indicator you could see other time frame candle in your chart.
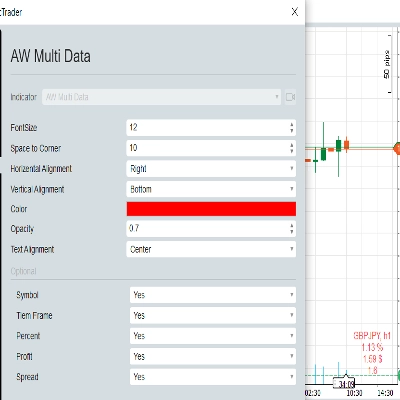
show spread on chart
this indicator show macd on chart.
Multi Time Frame Moving Average is a powerful and flexible indicator for cTrader
 this moving include everything that a trader needs from Moving Average.
this indicaotr show distance between Tenkan to Kijun, Close to Kijun and Close to Tenkan 
Add Slowing to IR Moving Average.
IR Candle Open plots customizable opening price lines for daily, weekly, and monthly candles
Coral indicator
you could put your check list in your chart you could split your test with “,” you could put your checklist in indicat
this indicator show other time frame close in lower time frame. for ex: show daily close in m 15.
don't move to the end of chart after timeframe changing. it should be better to use for near history. for long history

猜您喜欢

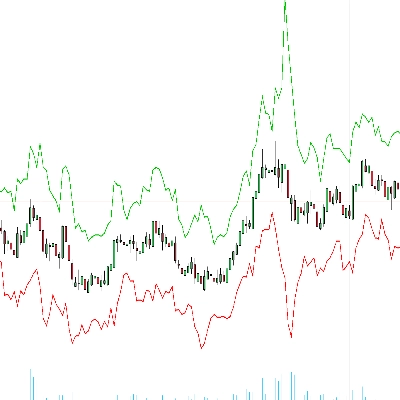
Enhance trading with ATR Bands! Visualize market volatility using dynamic upper and lower ATR bands for precise decision
Trading.FC$_vwap Algo shows VWAP trends, dynamic support/resistance and deviation bands to spot potential trade entries.
Displays the previous day's, last week's, and last month's highest and lowest price levels on your chart.
Opening ranges, dynamic trend channels, and multi-scale breakout/retest analysis for clear intraday chart decisions.
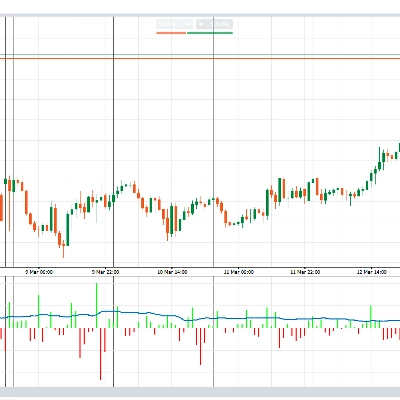
Volume Delta Oscillator Free Indicator
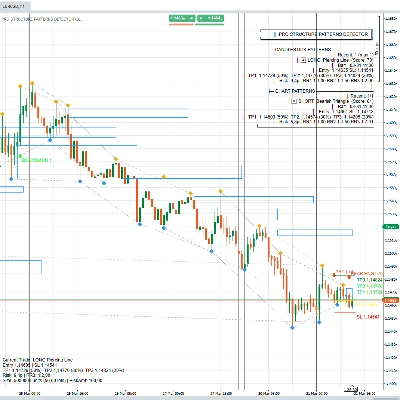
Pro Structure & Candlestick Patterns Detector
Half Trend Cloud
Unlock VWAP in cTrader! Choose anchor periods, price sources, and display deviation bands with real-time tick updates.
AI-powered daily range forecasts help traders spot volatility opportunities and plan stops and targets.
Trend direction, chart signals, reversal zones and volume tools in one configurable indicator.
A straightforward yet effective tool signals entry points for both buying and selling. Include 3 Moving Average
Customize the MACD! Choose colors, get real-time tick updates, and see crossover points for enhanced trading precision.
Smart trendline breakout indicator with auto signals, targets, and ATR-based zones for precise trade execution.
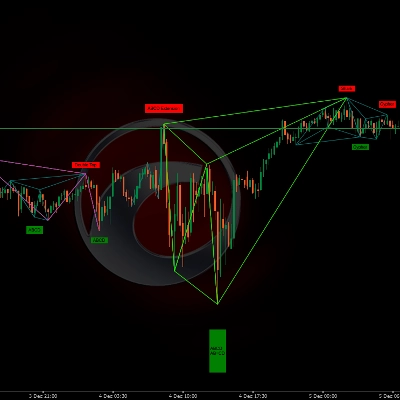
🚨Detection of geometric price patterns (Harmonic Patterns) and market structures based on price action📈
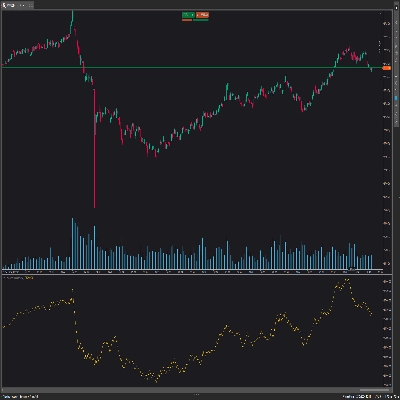
On Balance Volume (OBV) measures buying and selling pressure as a cumulative indicator.
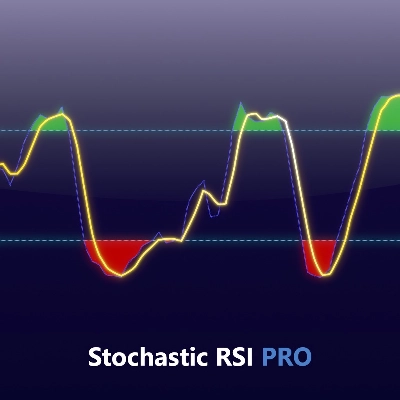
Unlock Stochastic RSI PRO in cTrader! Overlay RSI, highlight zones, and identify divergences with customizable settings.
Multi VWAP. Three timeframes. One clean chart. Your Essential Trading Tool.
Fractals is a precision-engineered trading indicator for cTrader that reveals the hidden architecture of price action.

价格

5.63K
免费安装