present
Sign up and get $50 off your first purchase
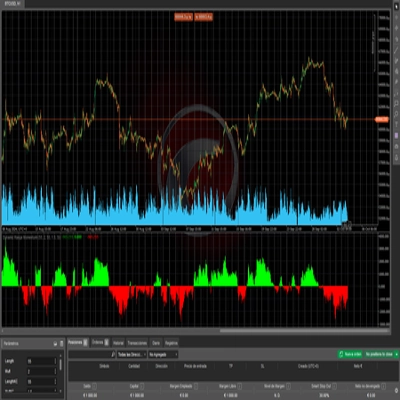
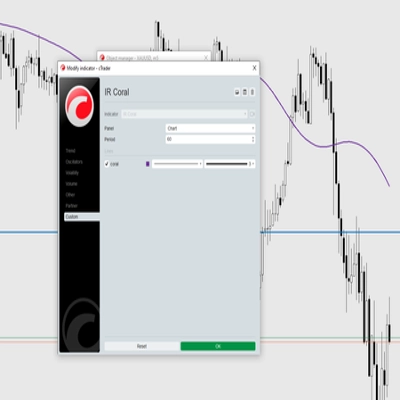
Trading product for IR Coral Indicator, image 1
IR Coral
5.0
Reviews: 1
5.66K
Free installs

Description

Coral indicator


Summary

AI summary
IR Coral is a technical indicator designed for use in trading platforms. It provides analytical insights based on market data to assist traders in making informed decisions. The product functions as a standalone indicator without specified trading strategies, timeframes, or market symbols. It does not include built-in risk management parameters or position sizing guidelines. IR Coral is intended for integration within trading interfaces to enhance market analysis through its indicator outputs.
Indicator profile

Discussion

Customer reviews

5.0
Reviews: 1
5
100 %
4
0 %
3
0 %
2
0 %
1
0 %
Customer reviews
August 2, 2025

FAQ

Products available through cTrader Store, including trading bots, indicators and plugins, are provided by third-party developers and made available for informational and technical access purposes only. cTrader Store is not a broker and does not provide investment advice, personal recommendations or any guarantee of future performance.
More from this author

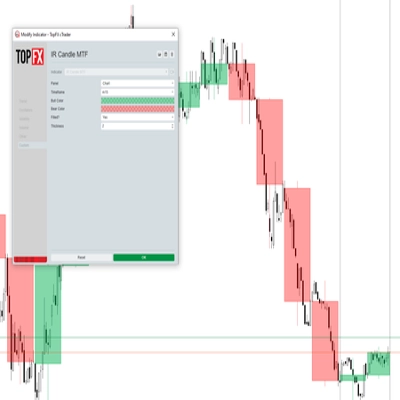
with this indicator you could see other time frame candle in your chart.
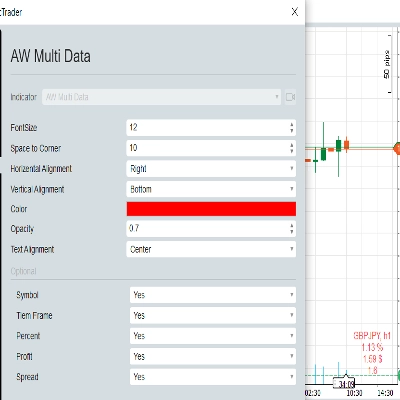
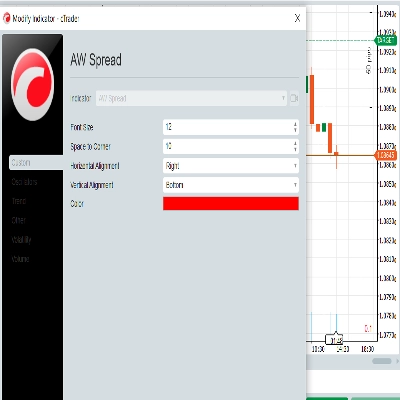
show spread on chart
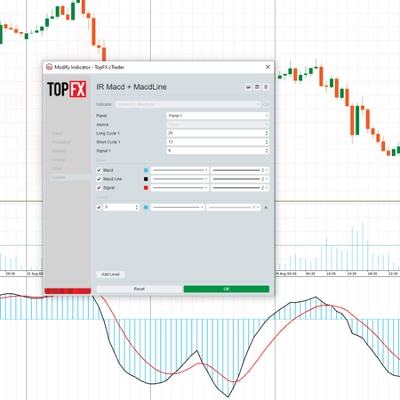
some user add moving average to macd to see better. in ctrader 4.3.11 there is a problem with this . I make a macd tha
this indicator show macd on chart.
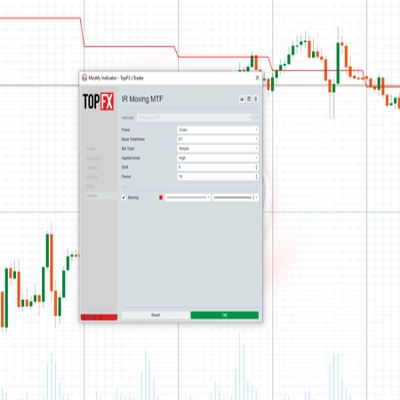
Multi Time Frame Moving Average is a powerful and flexible indicator for cTrader
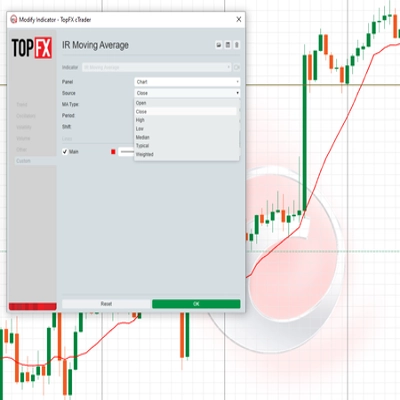
 this moving include everything that a trader needs from Moving Average.
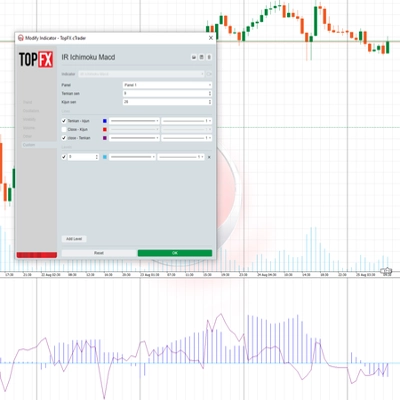
this indicaotr show distance between Tenkan to Kijun, Close to Kijun and Close to Tenkan 
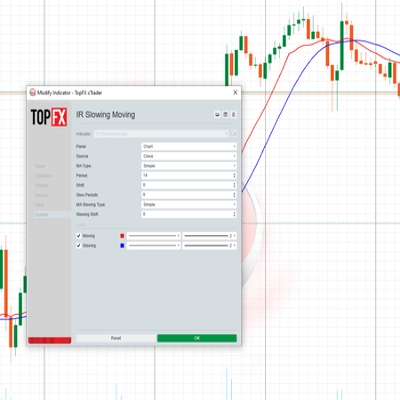
Add Slowing to IR Moving Average.
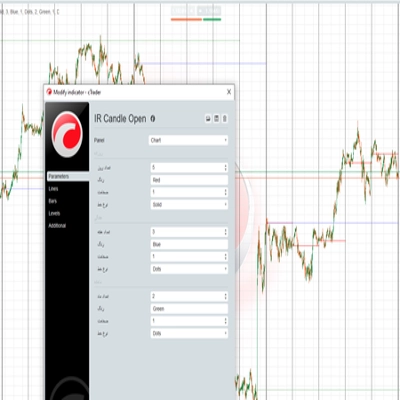
IR Candle Open plots customizable opening price lines for daily, weekly, and monthly candles
you could put your check list in your chart you could split your test with “,” you could put your checklist in indicat
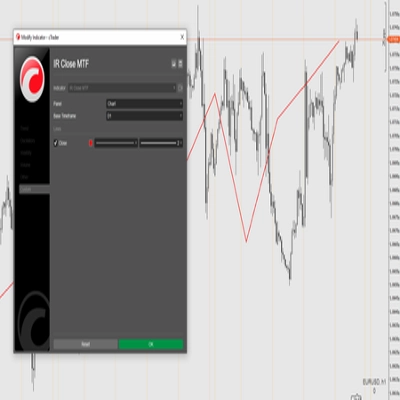
this indicator show other time frame close in lower time frame. for ex: show daily close in m 15.
don't move to the end of chart after timeframe changing. it should be better to use for near history. for long history

You may also like

Turn WaveTrend Cross into a BTC profit machine precise buy sell signals, smart momentum edge, no lag trading system
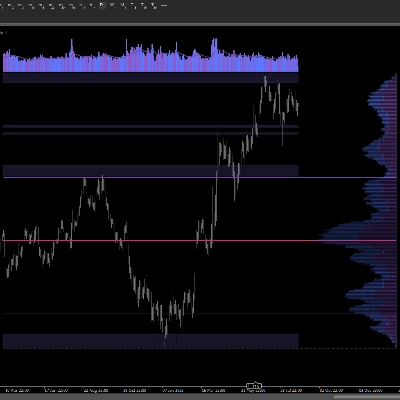
Right-anchored cTrader Volume Profile with VAH/VAL/POC, LVZ, top volume+EMA, themes, and fast, readable visuals.
Indicator designed to calculate and manipulate price inputs (sources) in real time
This histogram helps visualize the strength and direction of market movements, making it easier to spot potential trends
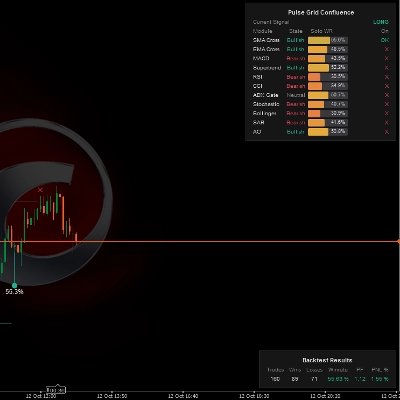
Multi-indicator confluence HUD & real-time backtest engine to detect trend alignment and filter high-probability setups.
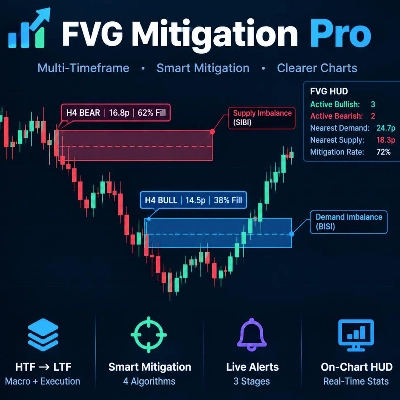
Fair Value Gap scanner with live fill telemetry, 50% CE lines, 4 mitigation rules, and a 3-stage native alert system.
AI-powered KNN machine learning indicator for cTrader. Features dynamic ATR targets, trend filters & Telegram alerts.
⚡ ADXVMA Aurora Trend Filter combines ADX trend strength with an adaptive EMA blend ⚡
A simple tool to control market sessions. fixed the display on the weekend.
Identify key support and resistance levels through detailed volume distribution analysis.
Market structure with BOS and CHoCH, order blocks, and retest buy/sell arrows with entry, stop and two targets
Smart Money Concepts (SMC) indicator with real-time Fair Value Gap (FVG) boxes, $50 round numbers, and live market HUD.
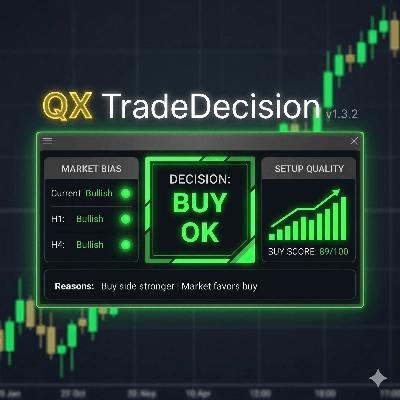
Decision panel with Buy/Sell scores, market bias, setup quality, trading cost and clear trade reasons.
PRO Liquidity Sweep + FVG Combo detector with custom Gold/Blue signals & alerts
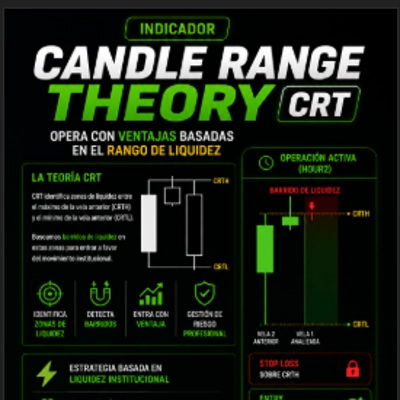
CRT Sweep Tracker is an advanced panel for Candle Range Theory (CRT) traders to track HTF sweeps and manage live trades.
Channel Trading is a volatility-based indicator using envelope theory to spot price breakouts and trade signals.
Support Resistance Toolkit
Displays real-time balance, equity, P&L, margin metrics directly on your charts.

Price

5.66K
Free installs