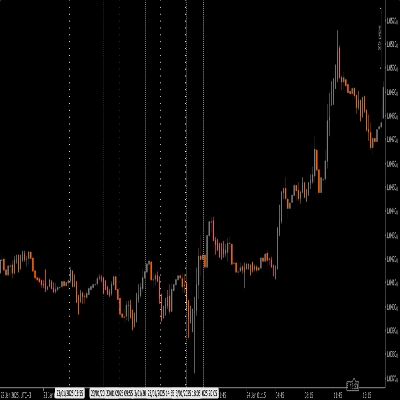
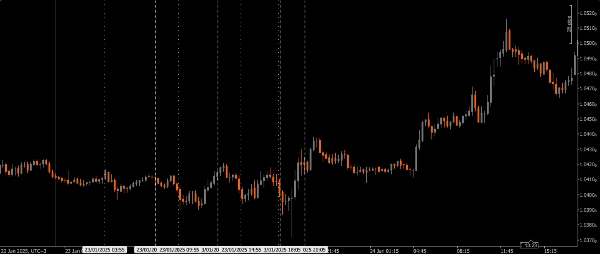
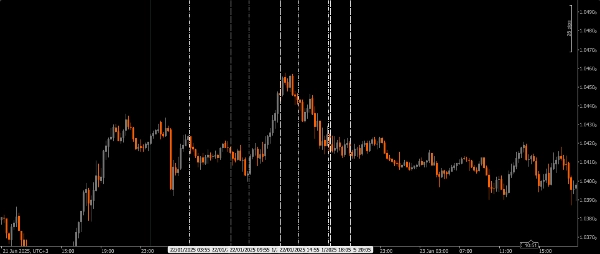
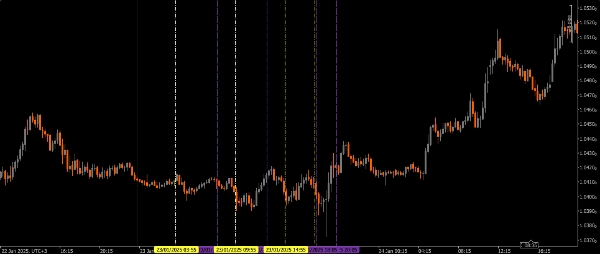
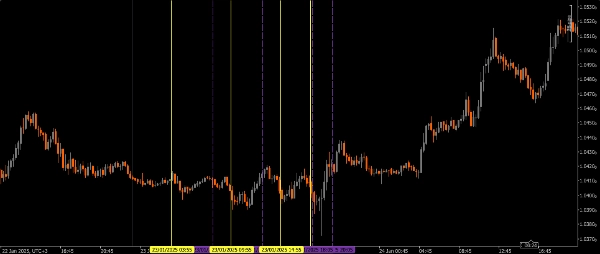
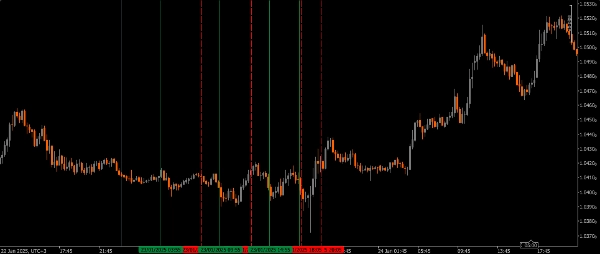
经纪商和自营
面向企业
00
Days
:
00
Hours
:
00
Minutes
:
00
Seconds
Killzone_Tidypips
指标
211 下载
Version 1.0, Jan 2025
Windows, Mac
4.0
评价:1
注册日期 19/11/2024
销售
15
免费安装
3699
"Killzone_Tidypips" 已上传图片"Killzone_Tidypips" 已上传图片"Killzone_Tidypips" 已上传图片"Killzone_Tidypips" 已上传图片"Killzone_Tidypips" 已上传图片
4.0
评价:1
5
0 %
4
100 %
3
0 %
2
0 %
1
0 %
客户评价
August 12, 2025
Pros: Visual session zones, customizable, great for ICT strategies. Cons: No alerts, no per-session toggle, possible chart clutter.

该作者的其他作品

ICT Killzone and Sessions high_low
This indicator is an essential tool for traders seeking to visualize key trading sessions on their charts.
指标
XAUUSD
Commodities
FVG_tidypips
A Fair Value Gap (FVG) indicator that identifies potential price imbalances, potential reversal and continuation zones
Previous Day Liquidity Zones (PDH - PDL)
Useful indicator for traders who want to visualize key price levels based on previous daily highs and lows.
Daily Open Pivot Level
This indicator is a valuable tool for traders looking to identify significant opening price level of any asset.
Moving Average channel
This indicator is designed to display customizable moving averages (MAs) on a chart.
Weekly Expansion (Premium_Discount Pivots)
Very handy tool for traders looking to visualize previous days premium and discount price levels.
Drawing Utility
A rectangular box with 5 adjustable Fibonacci level or even custom ones.
指标
XAUUSD
Commodities
True Open Pivot Levels
This indicatorFull Description: Th shows the open price lines at key market times based on Eastern Standard Time (EST).
Previous Day Equilibrium (Premium & Discount)
Plots the equilibrium price levels based on previous daily highs and lows.

猜您喜欢

指标
NAS100
NZDUSD
XAUUSD
+14
Donchian Channel Pro
Tracks N-period highs/lows, HTF overlay, HUDs with ADX, RSI, session clocks. Customizable for precise trading.
指标
RSI
Breakout
Supertrend
Zig-Zag Extremity Tracker
Dynamically adjusts regression channels based on ZigZag extremes, resetting when price breaks bands to track real trends
指标
RSI
Breakout
XAUUSD
+4
Dynamic Market Structure Analysis of Turning Points
Identify market structure effortlessly with swing highs, lows, CHoCH, and BOS levels for smart trading decisions! 📊🔍"
指标
NAS100
NZDUSD
XAUUSD
+10
Moving Average PRO
Customize your Moving Average! Choose any timeframe and price source for precision and flexibility in your analysis.
IR Ichimoku Macd
this indicaotr show distance between Tenkan to Kijun, Close to Kijun and Close to Tenkan 
KANDIKA HEAT MAP
Color-Based Market Pressure & Volatility Visualizer The Kandika Heatmap Indicator
指标
Breakout
XAUUSD
Commodities
+11
BOS CHOCH PRO 3.0
BoS ChoCH Pro,Strict Mode,False Breakout Filter,Average hit rate: 72-78%
IR Spread
show spread on chart
Session Highlight Framer
Frame the sessions
ICT Killzone and Sessions high_low
This indicator is an essential tool for traders seeking to visualize key trading sessions on their charts.
指标
NAS100
XAUUSD
Breakout
+14
Market_Profile_Prodessional
Market Profile TPO for cTrader — full auction logic, IB, POC, VA zones, histogram and O/X markers with time
指标
Indices
XAUUSD
Breakout
+9
Market Bias Gauge
Measure Market Strength at a Glance – Instantly