
Beschreibung
*DIE ÖFFNUNGSZEITEN UNTERSCHEIDEN SICH ZWISCHEN DEN VERMÖGENSKLASSEN
*STANDARDZEITWERTE GELTEN FÜR NQ/ES/YM (FUTURES)
*ZEITWERTE SOLLTEN IN EASTERN STANDARD TIME (EST) ANGEGEBEN WERDEN
Hauptmerkmale:
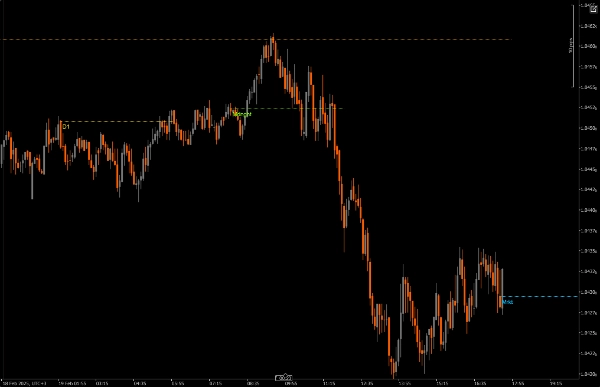
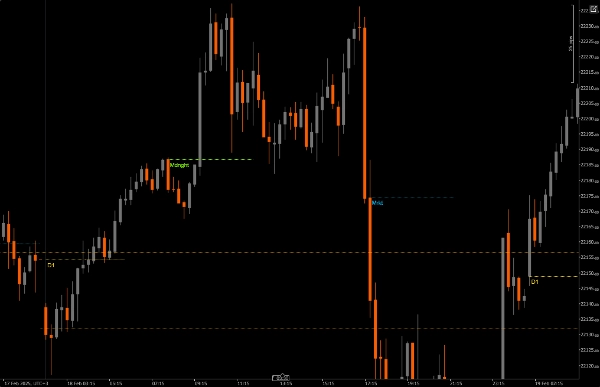
Zeitbasierte Preisniveaus
Zeichnet Eröffnungspreislinien zu den Öffnungszeiten wichtiger Marktzeiten
Alle Zeiten sind auf Eastern Standard Time (EST) synchronisiert
Jede Zeitperiode ist farblich codiert für eine einfache Identifikation
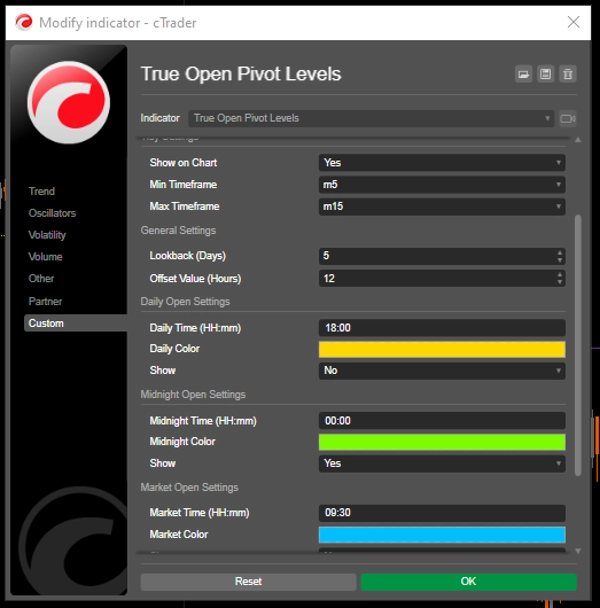
3 anpassbare Sitzungsmarkierungen:
Tägliche Eröffnung (12:00 AM EST) - Standard Gold
Mitternachtseröffnung (4:00 AM EST) - Standard Grün
Markteröffnung (9:30 AM EST) - Standard Blau
Jede Sitzung kann unabhängig ein- oder ausgeschaltet werden
Visuelle Anpassung:
Anpassbare Linienstärke
Mehrere Linienarten (durchgezogen, gepunktet, gestrichelt)
Anpassbare Farben für jede Sitzung
Optionale Zeitbeschriftungen mit EST-Zeiten
Linienversatz konfigurierbar bis zu 48 Stunden
Flexible Zeitrahmen-Unterstützung:
Festlegung von minimalen und maximalen Zeitrahmen für die Anzeige
Verhindert Überfüllung des Charts bei ungeeigneten Zeitrahmen
Optimiert für M5-M15 Zeitrahmen
Zeiteinstellungen:
Alle Zeiten sind in EST
Passen Sie die Sitzungszeiten an Ihre Handelsstrategie an
Passen Sie die Liniedauer basierend auf Ihren Analysebedürfnissen an
Visuelle Einstellungen:
Passen Sie die Linienstärke für bessere Sichtbarkeit an
Wählen Sie den Linienstil basierend auf der Chartklarheit
Beschriftungen nach Bedarf ein- oder ausschalten
Farben an Ihr Chart-Thema anpassen
Allgemeine Einstellungen:
Definieren Sie minimale/maximale Zeitrahmen
Passen Sie die Liniedauer für erweiterte Analysen an
Beste Praktiken:
Beginnen Sie mit den Standardeinstellungen und passen Sie diese nach Bedarf an
Verwenden Sie unterschiedliche Farben für jede Sitzung zur klaren Unterscheidung
Erwägen Sie, die Liniedauer bei niedrigeren Zeitrahmen zu verkürzen, um Überfüllung zu vermeiden
Beschriftungen zunächst aktivieren, um die Zeitpunkte zu verstehen, bei Überfüllung deaktivieren
Passen Sie die Indikator-Zeitrahmeinstellungen an Ihren Handelszeitrahmen an
Dieser Indikator ist besonders nützlich für:
Daytrader mit Fokus auf US-Märkte
Trader, die Sitzungsöffnungen verfolgen müssen
Personen, die um wichtige Marktereignisse handeln
Trader, die mehrsitzungsbezogene Kursbewegungen analysieren
Jeder, der eine klare visuelle Referenz für EST-Marktzeiten benötigt
Zusammenfassung
Kundenbewertungen
5 | 100 % | |
4 | 0 % | |
3 | 0 % | |
2 | 0 % | |
1 | 0 % |


![„[Stellar Strategies] Inside Bar with Signals“-Logo](https://cdn.ctrader.com/image/webp/1d9e8bfa-3b2c-4440-bb37-5856902008a7_30683)


