
Descripción
Guía de Usuario de WinSMC
1. Propósito
`WinSMC` es un indicador SMC superpuesto para cTrader. Te ayuda a identificar visualmente:
- Cambios en la estructura del mercado
- `BOS` (Ruptura de Estructura)
- `MSS` (Cambio de Estructura del Mercado)
- `Bloques de Orden`
- `Capturas de Liquidez` / `Barridos`
- `FVG` (Brechas de Valor Justo)
No es un sistema de trading automático. Es una herramienta de estructura y contexto que se usa mejor para trading basado en confirmaciones.
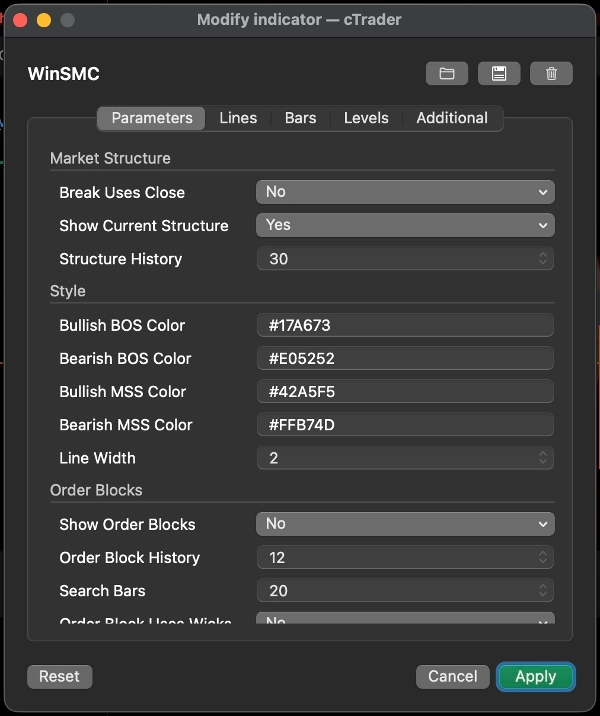
2. Conceptos Básicos
Longitud del Swing
`Longitud del Swing` controla cuán lejos a la izquierda y derecha debe confirmarse un pivote antes de considerarse un punto de swing válido.
Guía práctica:
- Valores más pequeños = más señales, más ruido
- Valores más grandes = menos señales, estructura más limpia
La Ruptura Usa el Cierre
Esta configuración decide si una ruptura de estructura se confirma por:
- `Sí`: cierre de vela
- `No`: ruptura de mecha/minimo/máximo
Guía:
- Usa el cierre para un enfoque más conservador
- Usa rupturas de mecha para una detección más temprana y sensible
Mostrar Estructura Actual
Muestra las líneas activas actuales de máximo y mínimo de swing, ayudándote a ver qué está respetando aún el mercado.
Historial de Estructura
Controla cuántas líneas y etiquetas de ruptura de estructura se mantienen en el gráfico.
3. BOS y MSS
BOS
`BOS` significa que el precio continúa en la misma dirección y rompe el máximo o mínimo previo.
Interpretación típica:
- En una tendencia alcista, romper el máximo previo es un BOS alcista
- En una tendencia bajista, romper el mínimo previo es un BOS bajista
MSS
`MSS` significa que el mercado ha cambiado de dirección respecto al sesgo previo.
Interpretación típica:
- Si el precio era bajista y rompe un máximo previo, eso es un MSS alcista
- Si el precio era alcista y rompe un mínimo previo, eso es un MSS bajista
Uso en trading
- `BOS` está más orientado a la continuación de la tendencia
- `MSS` está más orientado a la reversión
- Las mejores entradas suelen venir de un retesteo de un `Bloque de Orden` o `FVG`
4. Bloques de Orden
Un `Bloque de Orden` es la última vela opuesta antes de una ruptura de estructura. Comúnmente se trata como una zona de reacción de oferta/demanda.
Mostrar Bloques de Orden
Cuando está activado, el indicador mira hacia atrás después de un `BOS` o `MSS` y dibuja la zona de la última vela opuesta.
Significado
- OB alcista: después de una ruptura alcista, se usa la última vela bajista
- OB bajista: después de una ruptura bajista, se usa la última vela alcista
Cuando el precio comienza a interactuar con la zona, se marca como mitigada.
El Bloque de Orden Usa Mechas
Esto controla qué tan ancho se dibuja el cuadro:
- `Sí`: usa el rango completo de la vela, zona más amplia
- `No`: usa una zona central más ajustada
Guía:
- Usa `Sí` para una zona más amplia y conservadora
- Usa `No` para una zona más estrecha y precisa
Estrategia de Bloque de Orden
Flujo de trabajo común:
1. Espera un `BOS` o `MSS`
2. Marca el OB correspondiente
3. Espera el retesteo
4. Busca confirmación antes de entrar
No trates el OB como un punto de reversión garantizado. Es una zona de alto interés, no una certeza.
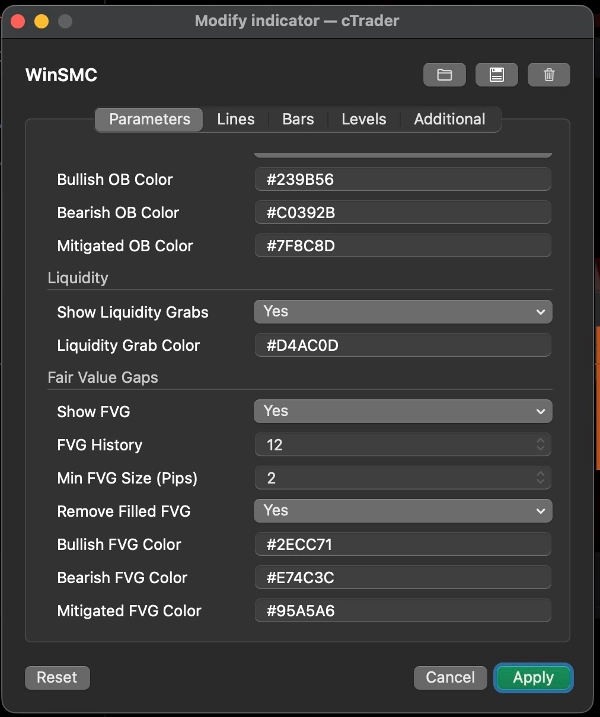
5. Capturas de Liquidez / Barridos
Una `Captura de Liquidez` significa que el precio supera un máximo previo o un mínimo previo, y luego cierra de nuevo dentro.
En este indicador:
- `Barrido del lado comprador`: el precio toma el máximo previo y cierra de nuevo por debajo
- `Barrido del lado vendedor`: el precio toma el mínimo previo y cierra de nuevo por encima
Esto usualmente significa que el mercado ha capturado liquidez y puede estar preparando el siguiente movimiento.
Importante
Un barrido por sí solo no es una señal de trading.
Se trata mejor como:
- Una advertencia de que la liquidez ha sido tomada
- Una pista para preparar una configuración
- Una razón para esperar un `MSS` o `BOS`
Uso común
- Después de un `Barrido del lado comprador`, un `MSS` bajista puede apoyar una configuración corta
- Después de un `Barrido del lado vendedor`, un `MSS` alcista puede apoyar una configuración larga
6. FVG
`FVG` es una Brecha de Valor Justo creada por un desequilibrio de tres velas.
Mostrar FVG
Cuando está activado, el indicador dibuja zonas visibles de FVG.
Regla de detección
- FVG alcista: el máximo de la primera vela está por debajo del mínimo de la tercera vela
- FVG bajista: el mínimo de la primera vela está por encima del máximo de la tercera vela
Tamaño mínimo de FVG (Pips)
Esto filtra brechas pequeñas.
- Unidad: `pips`
- Valor más alto = menos FVGs pero más significativos
- `0` = sin filtro de tamaño
Útil cuando el gráfico está saturado o cuando brechas muy pequeñas de 1 píxel no son útiles para tu flujo de trabajo.
Eliminar FVG llenas
Cuando está activado, las FVGs completamente llenas se eliminan del gráfico.
Estrategia FVG
Dos enfoques comunes:
1. Retroceso de tendencia
- Espera un `BOS` o `MSS`
- Espera que el precio retroceda hacia el FVG
- Opera en la dirección de la estructura
2. Entrada basada en confirmación
- Observa un barrido
- Espera un `MSS`
- Usa el FVG como la zona final de retroceso
7. Estilos de Trading Recomendados
Estrategia A: Continuación de Tendencia
Mejor cuando el mercado está claramente en tendencia.
Flujo de trabajo:
1. Espera un `BOS`
2. Marca el OB
3. Busca un retroceso hacia OB o FVG
4. Entra solo después de que el precio reaccione
Este es un enfoque clásico de seguimiento de tendencia.
Estrategia B: Barrido y luego Reversión
Mejor cuando el mercado es volátil y propenso a rupturas falsas.
Flujo de trabajo:
1. Detecta un `Barrido del lado comprador` o `Barrido del lado vendedor`
2. Espera el `MSS` opuesto
3. Usa OB o FVG como zona de retroceso
4. Entra después de la confirmación
Esto es más fuerte que operar solo el barrido.
Estrategia C: Confluencia de Barrido + MSS + OB/FVG
Esta es una de las formas más limpias de usar el indicador.
Flujo de trabajo:
1. Obtén un barrido
2. Obtén un MSS
3. Espera el retesteo de OB o FVG
4. Opera solo cuando las zonas se superponen
Esto reduce entradas prematuras.
8. Sugerencias Rápidas de Configuración
- `Longitud del Swing`: comienza con 5 o 7
- `La Ruptura Usa el Cierre`: activa para una vista más conservadora
- `El Bloque de Orden Usa Mechas`: activa para zonas más amplias
- `Tamaño mínimo de FVG (Pips)`: comienza con 2.0 y ajusta según el instrumento
- `Historial de Estructura` / `Historial de Bloque de Orden` / `Historial de FVG`: ajusta para mantener el gráfico legible
9. Nota Final
`WinSMC` se usa mejor como un mapa de estructura, no como un disparador de señal única.
El flujo de trabajo más confiable es:
- Identificar la dirección de la tendencia
- Observar el barrido de liquidez
- Esperar un MSS o BOS
- Usar OB o FVG como zona de entrada
- Entrar solo después de la confirmación
Resumen
The indicator helps traders analyze price action by marking swing highs and lows, confirming valid swing points based on customizable swing length, and distinguishing breaks using candle closes or wick extremes. Order Blocks are displayed as supply/demand zones derived from the last opposite candle before a structure break, with options to adjust zone width. Liquidity Sweeps indicate price movements beyond prior highs or lows that close back inside, signaling potential setups rather than direct trade signals. FVG zones are identified by three-candle imbalances and can be filtered by minimum size and removed once filled.
WinSMC supports multiple trading strategies, including trend continuation after BOS, reversal setups following liquidity sweeps and MSS, and confluence-based entries combining sweeps, MSS, and retests of Order Blocks or FVGs. It is intended as a confirmation and structure mapping tool rather than an automated trading system, aiding traders in timing entries with contextual market information.

![Logotipo de "[CB] Pivot Points Pro"](https://cdn.ctrader.com/image/webp/43463c82-67b0-4f10-a4ba-901bba091d81_32594)


![Logotipo de "Gaussian Channel [Iridio Capital]"](https://cdn.ctrader.com/image/webp/7c039209-5573-4a54-a072-f9528b503103_41960)
