
Description
Marre de passer une éternité à marquer vos graphiques ? Cet indicateur le fait pour vous super rapidement.
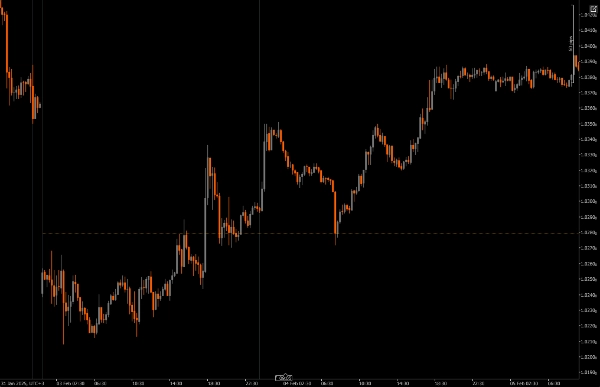
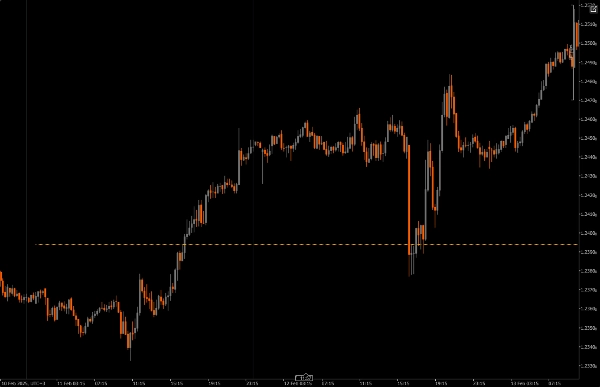
Il trouve le point médian entre le plus haut et le plus bas de la veille, et le trace sur vos graphiques. Maintenant, vous pouvez scanner vos graphiques très rapidement. Simple comme bonjour !
Quelques fonctionnalités intéressantes
Période de référence personnalisable : Vous pouvez choisir une période minimale et maximale pour tracer des niveaux de prix significatifs, ce qui aide à aligner vos trades intrajournaliers avec les tendances plus larges du marché.
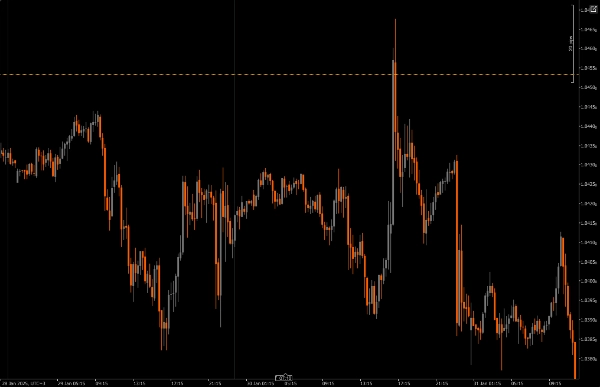
Ce qui rend cet indicateur spécial, c’est la capacité à suivre la bougie hebdomadaire au fur et à mesure qu’elle se forme jour après jour, ce qui facilite la capture de l’expansion de la bougie hebdomadaire.
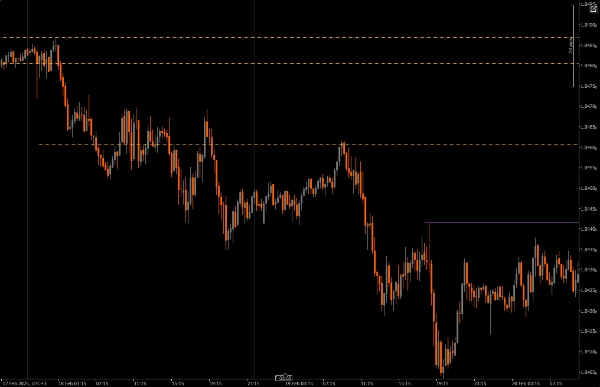
Paramètre de décalage : Cette fonctionnalité vous permet de décider jusqu’où dans le futur les niveaux tracés s’étendent, vous donnant une image plus claire des zones potentielles de continuation des prix.
Personnalisation visuelle : Vous disposez de nombreuses options pour ajuster les styles de ligne, l’épaisseur et les couleurs, ce qui facilite la création d’un graphique qui correspond à votre style personnel et est facile à lire.
Restrictions de période : L’indicateur inclut des vérifications pour s’assurer qu’il fonctionne uniquement dans les paramètres de période que vous avez spécifiés, afin d’éviter l’encombrement du graphique lorsque vous changez de période.
Points à noter :
Un favori personnel
Si vous êtes comme moi et ne pouvez pas vous passer de marquer vos graphiques, essayez cet indicateur. Il possède des restrictions de période et une fonctionnalité de période de retour visant à réduire l’encombrement du graphique.
Cet indicateur est utile pour suivre le développement de la bougie hebdomadaire ; si l’expansion hebdomadaire montre des signes d’un flux d’ordres haussier, alors les niveaux pivots de cet indicateur visualisent des zones pour rejoindre l’expansion haussière. De même, si l’expansion hebdomadaire montre un flux d’ordres baissier, alors les niveaux pivots de cet indicateur visualisent des zones pour rejoindre l’expansion baissière.
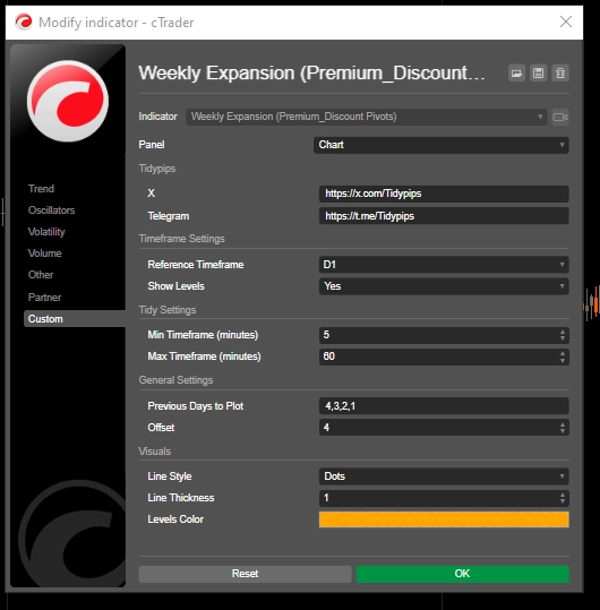
Installation : Commencez par télécharger et installer le Previous Day Equilibrium sur votre plateforme cAlgo.
Configuration : Ouvrez les paramètres pour choisir votre période de référence, sélectionnez le nombre de jours précédents que vous souhaitez tracer, et personnalisez les paramètres visuels selon vos préférences.
Analyse : Pendant que vous tradez, gardez un œil sur les niveaux tracés sur votre graphique. Ces niveaux indiquent où le prix pourrait potentiellement rebondir, basés sur l’action des prix historique, vous aidant à prendre des décisions plus éclairées.
Exécution : Utilisez ces niveaux pour déterminer vos points d’entrée et de sortie, ainsi que vos ordres stop-loss et take-profit, en les intégrant dans votre stratégie de trading globale.
Outils complémentaires recommandés :
cTrader : C’est la meilleure plateforme pour utiliser le Previous Day Equilibrium, offrant une expérience fluide pour la personnalisation et l’analyse.
Outils d’analyse technique : Associez cet indicateur à d’autres outils comme les moyennes mobiles ou les oscillateurs pour obtenir une vue plus complète des tendances du marché.
Outils de gestion des risques : Utilisez des calculateurs et des outils stop-loss pour gérer efficacement votre risque lors du trading autour de ces niveaux clés.
En utilisant le Previous Day Equilibrium, avec ces outils, vous pouvez améliorer votre stratégie de trading et augmenter vos chances de succès dans le monde rapide du trading intrajournalier.
Résumé
Avis clients
5 | 0 % | |
4 | 100 % | |
3 | 0 % | |
2 | 0 % | |
1 | 0 % |


