
Drawing Utility
Indicador
208 descargas
Versión 1.0, Jul 2025
Windows, Mac
Descripción
Alt + Arrastrar para activarlo en tus gráficos.
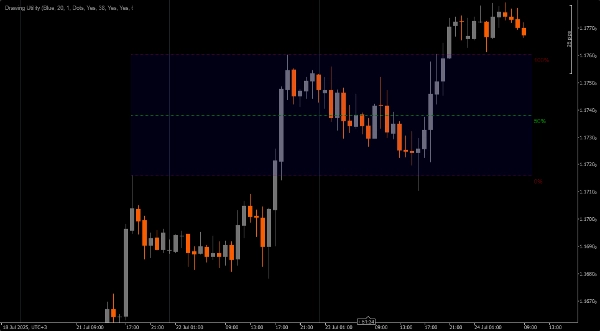
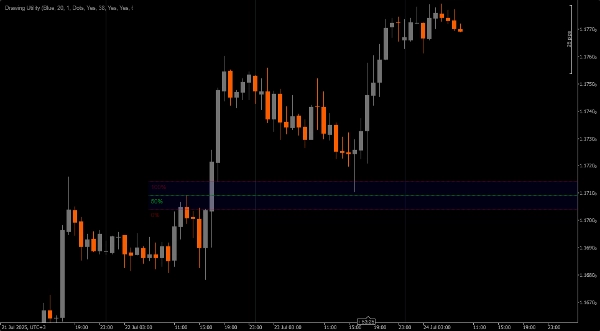
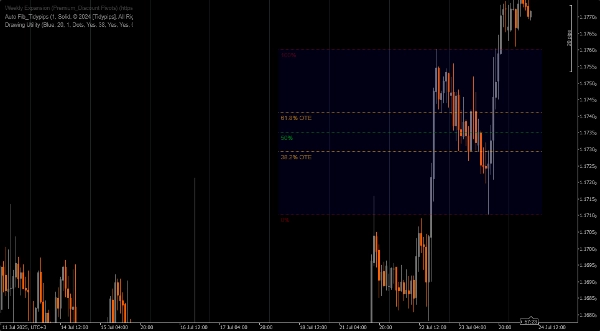
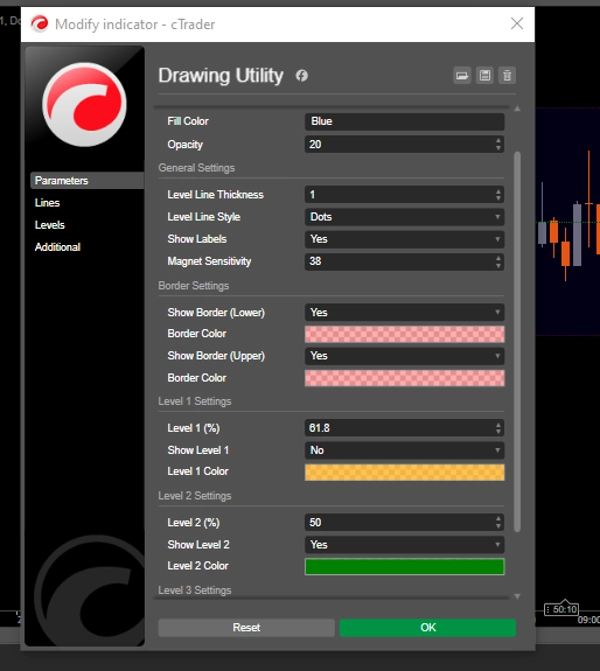
Utilidad de dibujo personalizable.
1. Acceso rápido a Fibonacci.
2. Marcador de Brecha de Valor Justo
3. Herramienta de medición
4. Marcador de Punto de Interés
5. o cualquier otro uso (en el que no he pensado) que puedas encontrar adecuado para anotar tus gráficos
NOTA **Alt + Arrastrar para activarlo en tus gráficos.**
Resumen
Resumen de IA
Drawing Utility is a customizable chart annotation tool designed for trading platforms. It features a rectangular box with five adjustable Fibonacci levels, which can also be customized to user-defined values. The utility is activated by pressing Alt and dragging on the chart. Key functionalities include quick access to Fibonacci retracement levels, marking Fair Value Gaps, measuring price movements, and highlighting Points of Interest. Additionally, it supports flexible use cases for various chart annotations, allowing traders to tailor it to their specific analysis needs.
Perfil del indicador
Valoraciones de clientes
0.0
Valoraciones: 0
Valoraciones de clientes
Este producto todavía no se ha valorado. ¿Ya lo ha probado? Sea el primero en informar a otros.
Conversación
Preguntas frecuentes
Los productos disponibles a través de cTrader Store, incluidos bots, indicadores y plugins para operar, son proporcionados por desarrolladores de terceros y están disponibles únicamente con fines informativos y de acceso técnico. cTrader Store no es un bróker, por lo que no proporciona asesoramiento de inversión, recomendaciones personales ni ninguna garantía de rentabilidad futura.
Más de este autor


Precio
15
Ventas
4.63K
Instalaciones gratis