
Trend Cycle
Indicador
179 descargas
Versión 1.0, Nov 2025
Windows, Mac
Descripción
Trend Cycle es una herramienta de análisis de tendencias que se centra en la duración de la tendencia, no solo en la dirección.
Esto:
- Detecta tendencias alcistas y bajistas basándose en la pendiente de una Media Móvil Hull (HMA).
- Cuenta cuántas barras la tendencia actual ha estado activa (Longitud Real).
- Almacena las duraciones de las recientes tendencias alcistas y tendencias bajistas por separado.
- Calcula la duración promedio de las tendencias alcistas y bajistas (Promedio alcista / Promedio bajista).
- Dibuja:
-
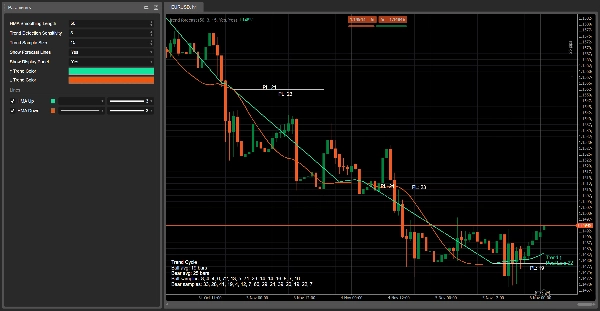
- Una HMA verde durante tendencias alcistas y una HMA roja durante tendencias bajistas.
- Líneas de proyección horizontales al inicio de cada tendencia, con una etiqueta como
PL: 18(Longitud Probable en barras). - Una etiqueta en vivo cerca del precio actual que muestra la dirección de la tendencia y la Longitud Real.
- Un panel de visualización con:
-
- duración promedio de tendencias alcistas y bajistas,
- listas de duraciones recientes de tendencias (hasta el tamaño de muestra seleccionado).
El objetivo es ayudarte a responder:
“¿Qué antigüedad tiene esta tendencia y cuánto suelen durar las tendencias como esta?”
Cómo funciona (lógica)
- Media Móvil Hull (HMA)
El indicador calcula una Media Móvil Hull del precio de cierre usando el parámetro Longitud de Suavizado HMA.
La HMA es más suave que una simple/EMA pero responde rápidamente a cambios de dirección. - Detección de tendencia por pendiente
Durante las últimas Barras de Sensibilidad para Detección de Tendencia, verifica la HMA:
Mientras se defina una tendencia, un contador (Longitud Real) se incrementa cada barra, representando la duración de la tendencia actual. -
- Si la HMA ha estado estrictamente subiendo → la tendencia es alcista (↑).
- Si la HMA ha estado estrictamente bajando → la tendencia es bajista (↓).
- De lo contrario, mantiene el estado de tendencia previo.
- Registro de duraciones de tendencias
Cuando la tendencia cambia de alcista a bajista o viceversa: -
- Se almacena la duración de la tendencia completada:
-
- tendencias alcistas en la lista de alcistas,
- tendencias bajistas en la lista de bajistas.
- Cada lista está limitada por el Tamaño de Muestra de Tendencias (por ejemplo, las últimas 10 tendencias).
- Estas muestras se usan para calcular:
-
- Promedio alcista = duración promedio de tendencias alcistas.
- Promedio bajista = duración promedio de tendencias bajistas.
- Proyecciones de Longitud Probable
Al inicio de cada nueva tendencia, si hay suficientes muestras:
Estas proyecciones se mantienen en el gráfico como historial para que puedas comparar visualmente la duración prevista vs la real de las tendencias. -
- Calcula la duración promedio para ese tipo de tendencia (alcista o bajista).
- Dibuja una línea horizontal desde la barra de inicio de la tendencia por aproximadamente esa cantidad de barras.
- Coloca una etiqueta en el centro de la línea:
-
PL: X→ Longitud Probable = X barras.
- Etiqueta en vivo
En cada barra, el indicador dibuja una única etiqueta en vivo cerca de la HMA:
Esto muestra la dirección actual de la tendencia y exactamente cuántas barras ha durado hasta ahora. -
- Texto de ejemplo:
-
Trend ↑
Real Len: 7
- Color:
-
- Verde (↑) para tendencias alcistas
- Naranja/rojo (↓) para tendencias bajistas
- Panel de visualización (abajo a la izquierda)
Cuando Mostrar Panel de Visualización está activado, aparece un panel de texto estático en la esquina del gráfico que muestra:
Esto actúa como una visión estadística rápida del comportamiento reciente de la tendencia en ese símbolo/marco temporal. -
- Título: Trend Cycle
Promedio alcista: X barrasPromedio bajista: Y barrasMuestras alcistas:lista de duraciones recientes de tendencias alcistasMuestras bajistas:lista de duraciones recientes de tendencias bajistas
Cómo leerlo en la práctica
- HMA verde + “Trend ↑”
→ Hay una tendencia alcista activa.
→Longitud Realte indica cuántas barras ha durado hasta ahora.
→ La línea más recientePL: Xte da una idea visual de cuánto suelen durar tendencias alcistas similares. - HMA roja + “Trend ↓”
→ Hay una tendencia bajista activa.
→Longitud Real= antigüedad de la tendencia bajista actual.
→ Compara Longitud Real conPromedio bajistaen el panel para ver si el movimiento es joven o maduro. - Cuando la Longitud Real se acerca o supera el promedio (Promedio alcista / Promedio bajista):
→ La tendencia actual es estadísticamente “vieja” comparada con la historia reciente.
→ Puedes optar por: -
- ajustar stops,
- asegurar ganancias,
- ser más cauteloso con nuevas entradas en esa dirección.
- Tendencias cortas vs tendencias largas
-
- Muchas tendencias muy cortas → entorno volátil / de reversión a la media.
- Pocas tendencias largas → mercado más direccional, con movimientos extendidos.
Resumen
Resumen de IA
Trend Cycle is a technical indicator designed to analyze trend duration in financial markets. It detects bullish and bearish trends by evaluating the slope of a Hull Moving Average (HMA) applied to closing prices, providing a smoother yet responsive measure of trend direction. The indicator counts the number of bars the current trend has been active (Real Length) and records the lengths of recent up-trends and down-trends separately. Using these samples, it calculates average durations for bullish and bearish trends.
Visual elements include a green HMA line during bullish trends and a red HMA line during bearish trends. Horizontal projection lines mark the probable length of each trend at its start, labeled with "PL: X" to indicate expected duration in bars. A live label near the current price displays the active trend direction and its age in bars. An optional display panel offers a summary of average trend durations and recent trend length samples.
Trend Cycle helps users assess how long the current trend has lasted relative to historical trends, aiding decisions such as adjusting stops or managing entries. It supports analysis across various markets including Forex, cryptocurrencies, indices, commodities, and stocks.
Perfil del indicador
Valoraciones de clientes
0.0
Valoraciones: 0
Valoraciones de clientes
Este producto todavía no se ha valorado. ¿Ya lo ha probado? Sea el primero en informar a otros.
Conversación
Preguntas frecuentes
BTCUSD
Forex
Signal
Breakout
Indices
EURUSD
Commodities
GBPUSD
NZDUSD
Martingale
Bollinger
Prop
ZigZag
Scalping
Supertrend
Crypto
Grid
Stocks
AI
XAUUSD
NAS100
USDJPY
Los productos disponibles a través de cTrader Store, incluidos bots, indicadores y plugins para operar, son proporcionados por desarrolladores de terceros y están disponibles únicamente con fines informativos y de acceso técnico. cTrader Store no es un bróker, por lo que no proporciona asesoramiento de inversión, recomendaciones personales ni ninguna garantía de rentabilidad futura.


Precio
42.11M
Volumen operado
6.13M
Pips ganados
228
Ventas
8.47K
Instalaciones gratis