Descripción
🌟 **¿Qué es el Z-Score?** 🌟
• **Z-Score en Trading**: Es una forma de medir qué tan lejos está el precio actual de su promedio reciente, expresado en términos de desviaciones estándar. 😊 Un valor cercano a 0 indica que el precio está cerca de su media, mientras que valores altos (positivos o negativos) 😮 indican que se ha desviado significativamente.
• **Utilidad Estadística**: Estos valores permiten identificar situaciones donde el precio está "sobrecomprado" 📈 o "sobrevendido" 📉, lo cual puede ser útil para estrategias de reversión a la media o para detectar momentos de alta volatilidad 💥.
🌟 **Cómo Funciona el Indicador** 🌟
1. **Cálculo del Promedio y Desviación**:
- Se analizan un número específico de barras anteriores (o períodos) para calcular el precio de cierre promedio y su desviación estándar. 🧮
- Con estos valores, se determina cuánto se desvía el precio actual de la media. Esta diferencia se expresa como un Z-Score.
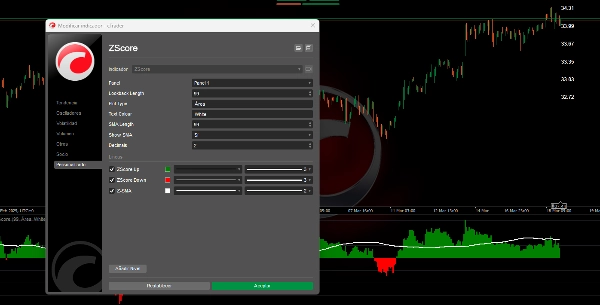
2. **Visualización del Z-Score**:
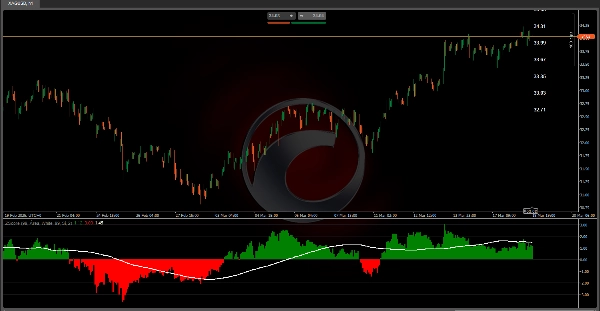
- **Modo Área**: Se muestran dos histogramas: uno en verde 🟩 para valores positivos (cuando el precio está por encima de la media) y otro en rojo 🔴 para valores negativos (cuando está por debajo). Esto permite identificar visualmente la magnitud y dirección de la desviación.
3. **Media Móvil del Z-Score**:
- Se calcula una media móvil sobre los valores del Z-Score. Esto ayuda a suavizar las fluctuaciones e identificar tendencias en cómo se comporta la desviación del precio a lo largo del tiempo. 📊
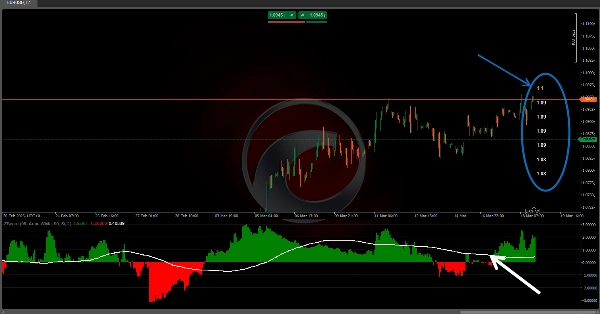
4. **Zonas de Probabilidad y Etiquetas de Referencia**:
- Además, se colocan etiquetas en el gráfico que muestran los precios correspondientes a la media y a cada nivel de desviación. Esto es útil para entender, en términos de precio, qué tan "extremo" se está comportando el mercado. ⚠️
---
🌟 **Interpretación y Aplicación para Traders** 🌟
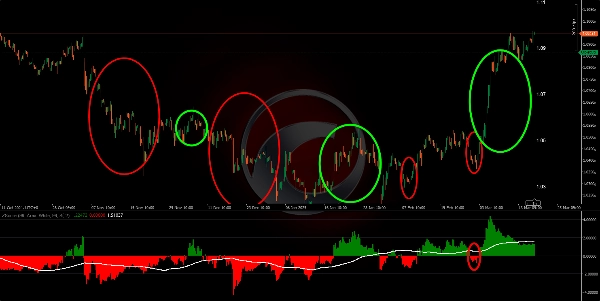
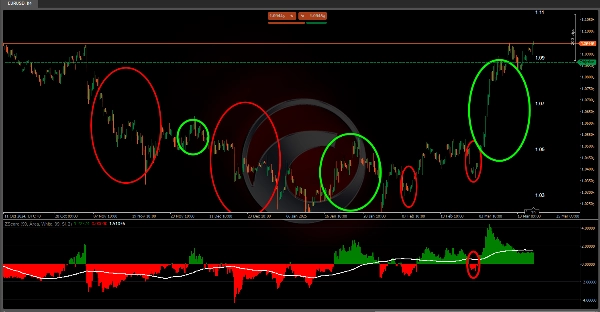
• **Detección de Extremos**: Al observar valores muy altos o muy bajos en el indicador, un trader puede identificar que el precio se ha alejado significativamente de su promedio. Esto puede sugerir que es probable una corrección (si se espera reversión a la media) 🔄 o que está ocurriendo una ruptura fuerte.
• **Confirmación de Tendencia**: La media móvil del Z-Score y las bandas asociadas permiten ver cambios en la tendencia del comportamiento del precio respecto a su media. Un cruce o cambio en estas líneas puede interpretarse como una señal de entrada 🛡️ o salida.
• **Gestión de Riesgos**: Al conocer los niveles de desviación y las zonas de probabilidad, puedes ajustar tamaños de posición o definir puntos de stop loss ⬇️ y take profit ⬆️, ya que tienes una referencia para movimientos normales versus extremos.
• **Comprensión Estadística del Mercado**: Más allá de ser solo una herramienta gráfica, este indicador fomenta pensar en el comportamiento del mercado en términos probabilísticos. Conocer la "normalidad" de un movimiento puede ser un factor decisivo al evaluar oportunidades de trading. 🎯
🌟 **Conclusión** 🌟
Este algoritmo convierte los datos de precios en una representación estadística que ayuda a visualizar y cuantificar la desviación del precio respecto a su comportamiento reciente. Al combinar el Z-Score, una media móvil, bandas de desviación y una tabla de probabilidad, el indicador proporciona múltiples capas de información. Esto lo hace especialmente valioso para identificar momentos en que el mercado está en condiciones inusuales, facilitando decisiones de entrada 🚀, salida 🛑 y gestión de riesgos basadas en probabilidad y estadística. 📈📉
Indicadores de Ctrader Store:
Dynamic Market Structure
Análisis de Puntos de Giro
Fibonacci Linear
Regresión Multitemporal
Multi-Level Candle Bias
Tracker
Auto Support and
Resistance Trend Lines
Resumen
Valoraciones de clientes
5 | 100 % | |
4 | 0 % | |
3 | 0 % | |
2 | 0 % | |
1 | 0 % |