
説明
🏆 10,000人以上のトレーダーが私たちの25以上のアルゴリズムスイートを信頼しています! 🏆
から マーケット構造&流動性 まで スマートエグジットシステム&予測ツール - 一貫した取引に必要なすべてのツールを構築しました。
👉 すべての25以上の実証済みシステムにアクセス:
_______________________________________________
📌 マーケット構造インジケーター
· ✅ AdvancedMarket Structure: Bos, Choch, SwinLevels, Order Blocks, マーケット構造&流動性ファインダー
· 🧱 オーダーブロック
· ⚖️ マーケットアンバランス
· ⛓️ BOS&CHOCH
· 🧠 ICTパワーオブ3
· 🌀 マーケットポラリティゾーン
_______________________________________________
🔚 スマートエグジットシステム
· 📍 トレーリングスマートアルゴリズム
_______________________________________________
📐 ジグザグインジケーター
· 🔍 ジグザグ価格流動性予測
· 🧭 S&R構造ジグザグ
· ➖ ジグザグ
· 🎯 ジグザグ極端トラッカー
_______________________________________________
🧱 サポート&レジスタンスインジケーター
_______________________________________________
📊 トレンド&チャネルインジケーター
· 🔄 オートトレンドチャネル
· 📊 スーパートレンド
· 🧠 アダプティブトレンドチャネル
· 💥 チャネルブレイクアウトシステム
· ⭐ プレミアムSSLチャネル
· 🔁 リアクティブ移動平均
_______________________________________________
💧 ボリューム&流動性ツール
· 🔥 ボリュームPOCヒートマップ
· 📉 レバレッジ清算マップ
· 🔍 モメンタムフェアバリューギャップ
· 🕒 フェアバリューギャップセッション
_______________________________________________
⚡ モメンタム&RSIインジケーター
· 📈 RSIトレンドトリガー
· 🚀 ダイナミックレンジモメンタム
_______________________________________________
🔮 予測&投影ツール
· 📐 Linreg&ATRに基づく予測
· 📈 ボリューム駆動マーケットフロープロジェクター_________________________
_________________________________________________________________________________________________
_________________________________________________________________________________________________
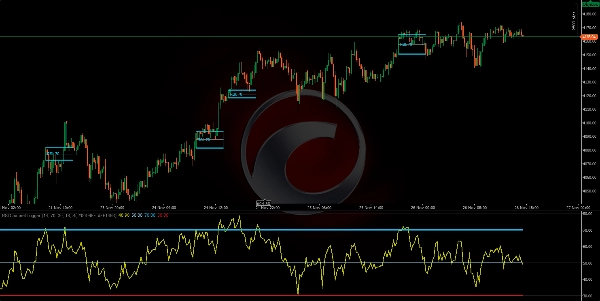
RSIチャネルトリガー: 📶
それは何か: RSI(期間)を計算し、RSIが買われ過ぎ/売られ過ぎの閾値(デフォルト70/30)を越えたときにモメンタムゾーンを視覚的にマークするインジケーターです。✅
https://chartshots.spotware.com/c/69278f8b6d973
ロジック: 閾値を越えると、そのクロスオーバー時のローソク足の高値/安値に基づいて「ゾーン」を作成します。そして:🧠
- そのゾーン内のローソク足に色を付けます。
- チャネル(高値、安値、中間)を描きます。
- RSIパネル上にクロスオーバーを円とラベルでマークします。
ゾーンは正確に MinZoneDuration バー続きます。⏱️
明確なシグナル:
- 買われ過ぎの上へのクロスオーバー → 強気ゾーンを開始。🟢
- 売られ過ぎの下へのクロスオーバー → 弱気ゾーンを開始。🔴
ゾーン自体は 注目エリアであり、注文ではありません。
https://chartshots.spotware.com/c/69278fb274e0b
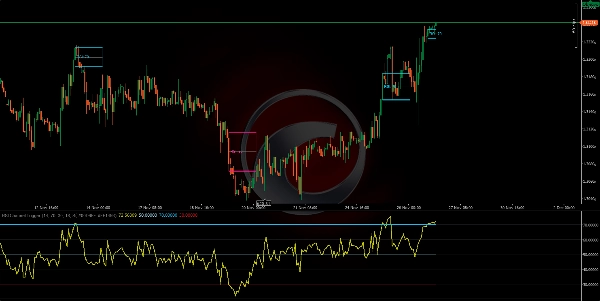
使い方(簡単に):
- ゾーンが形成されるのを待ちます。🎯
- 価格アクションで確認します(チャネルラインからのブレイクアウト/拒否)。
- ゾーンの外にストップロスを置き、チャネル中間線または定義されたリスクリワード比率にターゲットを設定してエントリーします。
https://chartshots.spotware.com/c/69278fe76237b
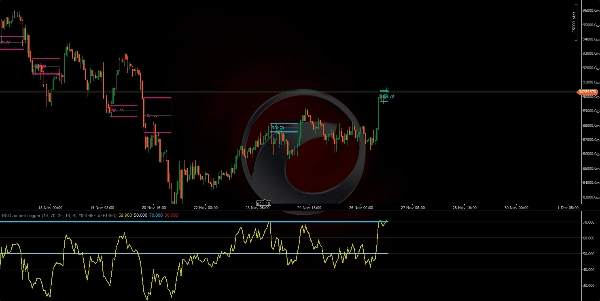
主要パラメーター: ⚙️
- RSI期間(14)
- 買われ過ぎ(70)
- 売られ過ぎ(30)
- MinZoneDuration(15)
- 設定可能な色 🎨
概要
Clear signals include:
- RSI crossing above the overbought level, initiating a bullish momentum zone.
- RSI crossing below the oversold level, initiating a bearish momentum zone.
These zones serve as areas of interest rather than direct trade orders. Users can confirm signals with price action such as breakouts or rejections from channel lines and plan entries with stop losses placed outside the zone and targets at the mid-channel line or based on risk/reward ratios.
The indicator supports multiple markets and symbols including Forex pairs (EURUSD, GBPUSD, NZDUSD, USDJPY), commodities (XAUUSD), indices (NAS100), cryptocurrencies (BTCUSD), and stocks. It offers configurable parameters for RSI period, threshold levels, zone duration, and colors.


![「[Hamster-Coder] Bollinger Bands」ロゴ](https://cdn.ctrader.com/image/webp/21d8e5d6-fb11-4bac-b9ee-cd05c2b76804_30327)


