
ADX and ADI
インジケーター
258 ダウンロード数
バージョン 1.0、Aug 2025
Windows、Mac
5.0
レビュー: 2
説明
主な特徴:
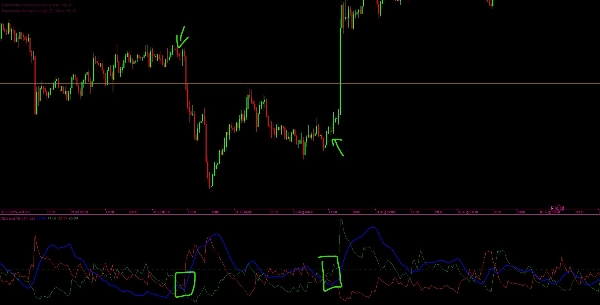
- ADXおよびADIライン(青): 方向に関係なく、現在のトレンドの平滑化された強さを示します。
- +DIライン(緑): 上昇の強さを示します。
- -DIライン(赤): 下降の強さを示します。
- しきい値ライン(灰色): トレンドの強さが重要かどうかを判断するための水平参照レベル(デフォルトは25)です。
仕組み:
- インジケーターは真の範囲(TR)、正の方向性移動(+DM)、および負の方向性移動(-DM)を計算します。
- これらのTR、+DM、-DMの平滑化された値を計算するために、ワイルダーの平滑化手法を適用します。
- これらから、方向性指標(+DIおよび-DI)が導き出され、どちらの側(強気または弱気)がより強い勢いを持っているかを示します。
- +DIと-DIの相対的な差からDX(方向性指数)が計算されます。
- 最後に、ADX(平均方向性指数)はDXの平滑化バージョンとして計算され、全体的なトレンドの強さの指標を提供します。
解釈:
- ADXがしきい値(例:25)を上回っている場合、市場は強いトレンドにあると見なされます。
- +DI > -DIのとき、強気が優勢(上昇トレンド)です。
- -DI > +DIのとき、弱気が優勢(下降トレンド)です。
- ADXがしきい値を下回っている場合、市場はレンジ相場(弱いまたはトレンドなし)と見なされます。
概要
AIによる概要
This custom indicator provides a full implementation of the Average Directional Index (ADX) and Directional Indicators (DI) to measure trend strength and direction in financial markets. It displays four key lines: the ADX and ADI line (blue) representing smoothed trend strength regardless of direction; the +DI line (green) indicating upward movement strength; the -DI line (red) indicating downward movement strength; and a threshold line (gray, default 25) to identify significant trend strength.
The indicator calculates True Range (TR), Positive Directional Movement (+DM), and Negative Directional Movement (-DM), applying Wilder’s smoothing technique to derive smoothed values. From these, it computes the +DI and -DI lines to show bullish or bearish momentum. The Directional Index (DX) is calculated from the relative difference between +DI and -DI, and the ADX is a smoothed version of DX, quantifying overall trend strength.
Interpretation guidelines include: ADX above the threshold signals a strong trend; +DI greater than -DI indicates bullish control; -DI greater than +DI indicates bearish control; and ADX below the threshold suggests a ranging or weak trend market.
インジケーターのプロフィール
カスタマーレビュー
5.0
レビュー: 2
5 | 100 % | |
4 | 0 % | |
3 | 0 % | |
2 | 0 % | |
1 | 0 % |
カスタマーレビュー
December 1, 2025
ADX and ADI delivers clean trend strength and direction signals. ADX shows when the market is actually trending, while +DI and -DI reveal who’s in control. Stable, lightweight and reliable across all timeframes. Best on H1+ for smoother signals. Alerts and zone-highlighting would be great additions.
September 12, 2025
ディスカッション
よくあるご質問
cTrader Storeで入手可能な取引ボット、インジケーター、プラグインなどの商品は、第三者の開発者が提供するものであり、情報と技術の取得のみを目的としてご利用いただけます。cTrader Storeはブローカーではなく、投資助言や個人的な推奨を行うことも、将来のパフォーマンスを保証することもありません。


価格
登録日 21/02/2025
466.3M
取引数量
180.83K
獲得pips
22
販売
6.89K
無料インストール