
الوصف
افتح قوة السكالبينج الدقيق مع ScalpingSignals9000!
هل تبحث عن مؤشر قوي وموثوق ودقيق لتعزيز أدائك في التداول؟ ScalpingSignals9000 هو الأداة النهائية للمتداولين الذين يسعون إلى الدقة والكفاءة وإشارات تداول ذات احتمالية عالية في عالم الفوركس وتداول العقود مقابل الفروقات السريع.
لماذا تختار ScalpingSignals9000؟
✅ كشف الاتجاه المتقدم – يستخدم مزيجًا من المتوسطات المتحركة الأسية (EMA)، المتوسطات المتحركة البسيطة (SMA)، مؤشر القوة النسبية (RSI)، وأشرطة بولينجر (BB) لتحديد الاتجاهات القوية. ✅ إشارات شراء وبيع عالية الدقة – يكتشف نقاط الدخول المثلى مع تأكيد الاتجاه، مما يضمن التداول مع زخم السوق. ✅ التحقق من الاتجاه في أطر زمنية أعلى – ميزة اختيارية لتصفية الإشارات الضعيفة من خلال التحقق من اتساق الاتجاه خلال آخر 10 أشرطة. ✅ تصفية ذكية للإشارات – يتجنب الإشارات المتتالية للشراء أو البيع، مما يضمن تقديم فرص عالية الجودة فقط. ✅ تنبيهات بصرية وصوتية – يتم تمييز إشارات الشراء والبيع بوضوح على الرسم البياني بأسهم لأعلى ولأسفل، بالإضافة إلى إشعارات في الوقت الحقيقي.
كيف يعمل
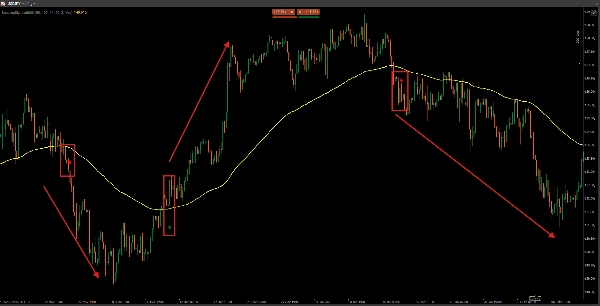
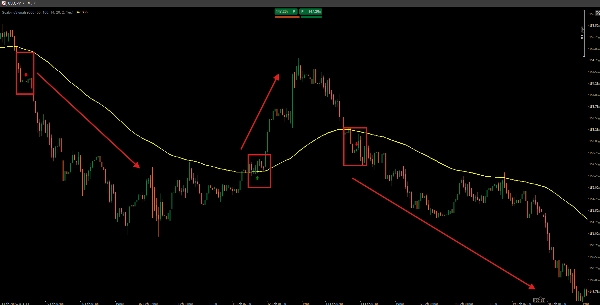
- يتم تفعيل إشارة شراء عندما يكون السعر في اتجاه صاعد، قريب من شريط بولينجر العلوي، ويتم تأكيده بواسطة التحقق من الاتجاه في إطار زمني أعلى.
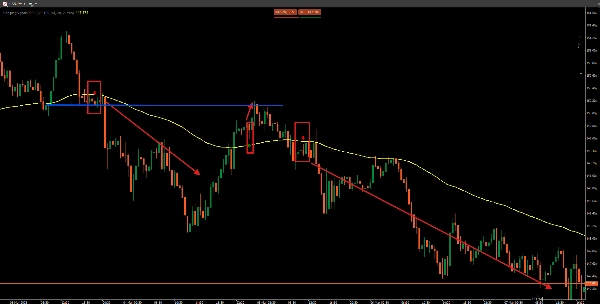
- يتم تفعيل إشارة بيع عندما يكون السعر في اتجاه هابط، بالقرب من شريط بولينجر السفلي، ويتم التحقق منه بواسطة تأكيد الإطار الزمني الأعلى.
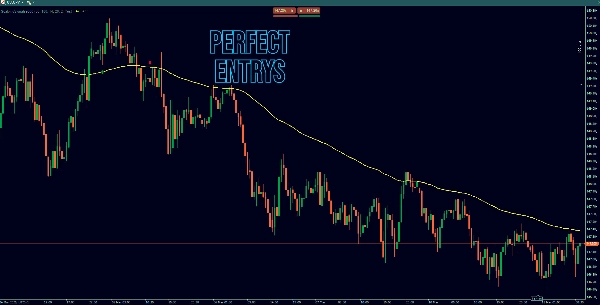
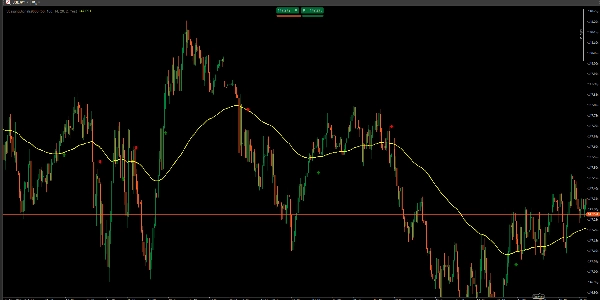
- يتم عرض المتوسط المتحرك الأسي (EMA) على الرسم البياني لتصور إضافي للاتجاه.
- إشارة واحدة فقط لكل تغيير في الاتجاه، مما يمنع التداولات غير الضرورية ويقلل المخاطر.
لمن هذا موجه؟
🚀 المتداولون السريعون الذين يبحثون عن تداولات سريعة ذات احتمالية عالية.
📈 متداولو اليوم الذين يسعون إلى دخول دقيق.
💡 متداولو التأرجح الذين يريدون تأكيد الاتجاه قبل الدخول في مركز.
احصل على ScalpingSignals9000 اليوم!
توقف عن التخمين وابدأ التداول بثقة. سواء كنت مبتدئًا أو متداولًا ذا خبرة، ScalpingSignals9000 سيساعدك على اتخاذ قرارات أذكى تعتمد على البيانات.
🔹 تحميل فوري
🔹 تثبيت سهل على cTrader
🔹 شراء لمرة واحدة – بدون رسوم شهرية!
💰 عرض لفترة محدودة – احصل على نسختك الآن! 💰
الملخص
Key features include advanced trend detection, high-accuracy buy and sell signals confirmed by higher timeframe trend validation, and smart signal filtering that prevents consecutive redundant signals. Buy signals occur when price is in an uptrend near the upper Bollinger Band, while sell signals trigger in downtrends near the lower band. The EMA is displayed on the chart for additional trend visualization. Only one signal is generated per trend change to reduce unnecessary trades.
The indicator provides clear visual and audible alerts with arrows and real-time notifications on the chart. It is suitable for scalpers, day traders, and swing traders who require quick, precise entries and trend confirmation. ScalpingSignals9000 is compatible with the cTrader platform and offers instant download and easy installation.
تقييمات العملاء
5 | 50 % | |
4 | 50 % | |
3 | 0 % | |
2 | 0 % | |
1 | 0 % |


![شعار "[Stellar Strategies] Moving Averages Combined 1.0"](https://cdn.ctrader.com/image/webp/93692c9d-ac16-4dd8-ba83-5a62250c39a9_27250)


