Descrição
O KasePeakOscillator (KPO) é uma ferramenta sofisticada de análise técnica projetada para identificar exaustão do mercado, reversões de tendência e mudanças de momentum. Ao contrário dos osciladores padrão, o KPO integra medidas estatísticas de volatilidade para fornecer sinais mais confiáveis em condições de mercado variadas.
Como Funciona: O indicador calcula a relação entre a ação do preço e a volatilidade histórica (Média do Intervalo Diário/Desvio Padrão). Ele avalia "Ciclos Curtos" contra "Ciclos Longos" para determinar se um movimento de preço é estatisticamente significativo ou apenas ruído do mercado. O resultado é um oscilador suave e responsivo que oscila em torno de uma linha zero.
Componentes Principais:
- O Histograma (KCD): Representa o momentum central. A travessia da linha zero indica uma mudança na tendência de curto prazo.
- Bandas Dinâmicas (Superior/Média): Estas atuam como limites estatísticos de "sobrecompra" e "sobrevenda". Elas se adaptam à volatilidade do mercado, expandindo durante períodos de alta atividade e contraindo durante consolidação.
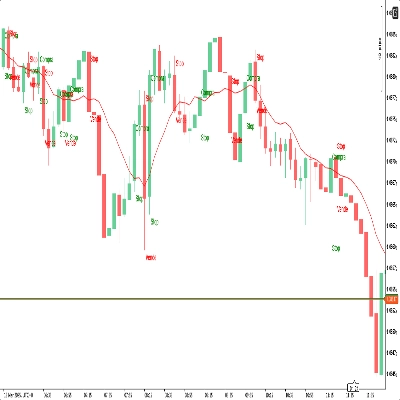
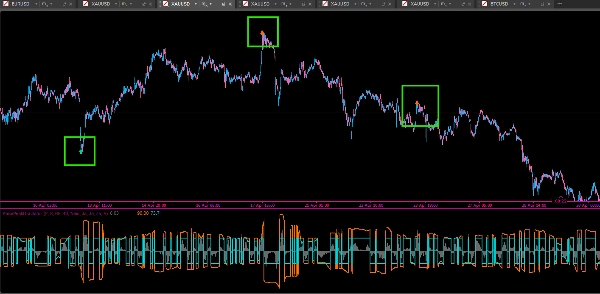
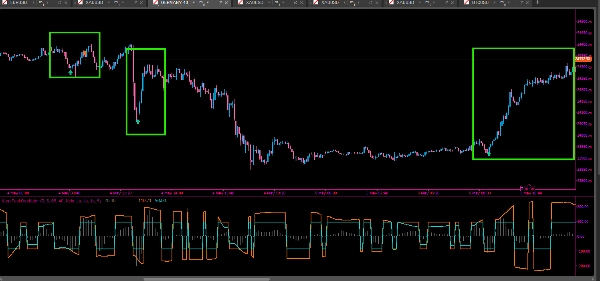
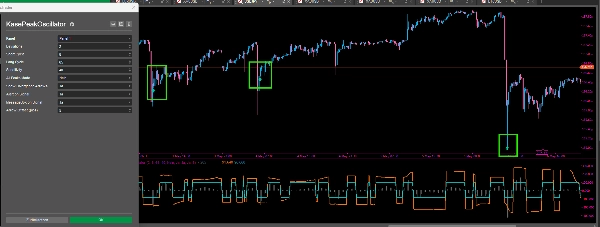
- Detecção Automática de Picos: O indicador identifica "Picos" e "Vales" onde o momentum atinge um extremo estatístico, sinalizando possível exaustão.
Estratégia de Negociação:
- Exaustão de Pico: Quando um pico de momentum ocorre fora das bandas dinâmicas (indicado por setas Verde-Menta ou Laranja), sugere que a tendência atual está estendida demais e uma reversão ou correção é provável.
- Sinais de Divergência: O KPO identifica automaticamente Divergências de Alta e Baixa. Uma divergência ocorre quando o preço faz um novo extremo, mas o oscilador não, indicando enfraquecimento do momentum. Estes são marcados com Azul Claro (Alta) e Dourado (Baixa) ícones.
- Confirmação de Tendência: Use a posição do Histograma em relação à linha zero para confirmar a direção da tendência. Permanecer acima de zero apoia posições longas, enquanto permanecer abaixo de zero apoia posições curtas.
Recursos:
- Sistema de Alerta Integrado (Som, Caixa de Mensagem e Ícones Visuais).
- Sensibilidade Ajustável para combinar com diferentes classes de ativos (Forex, Índices, Cripto).
- "Modo Todos os Picos" para scalping agressivo ou modo filtrado para setups de swing de alta probabilidade.
Resumo
Key components include:
- Histogram (KCD): Represents core momentum; zero-line crossings indicate short-term trend changes.
- Dynamic Bands: Volatility-adjusted thresholds signaling overbought or oversold conditions.
- Automated Peak Detection: Identifies momentum extremes signaling potential trend exhaustion.
The KPO provides automated alerts for peak exhaustion and divergence signals, marking bullish and bearish divergences when price and momentum disagree. Trend direction can be confirmed by the histogram’s position relative to zero.
Features include adjustable sensitivity for various asset classes such as Forex, indices, and cryptocurrencies, an integrated alert system (sound, message, visual icons), and modes tailored for scalping or swing trading. The indicator supports analysis based on price bars and outputs reversal and divergence signals to assist in trading decisions.
Avaliações de clientes
5 | 100 % | |
4 | 0 % | |
3 | 0 % | |
2 | 0 % | |
1 | 0 % |