
Descripción
Proyección Dinámica de Precio 📈🔮
https://chartshots.spotware.com/c/69d5304ea1cc1
¿Qué es?
https://chartshots.spotware.com/c/69d52fb4b01cd
Proyección Dinámica de Precio es un indicador superpuesto que proyecta caminos futuros de precio estadísticamente probables usando simulación Monte Carlo y evalúa el sesgo direccional mediante un clasificador de probabilidad bayesiano. Responde a una pregunta: dado cómo se ha estado moviendo este activo, ¿a dónde es estadísticamente probable que vaya a continuación? 📊
https://chartshots.spotware.com/c/69d53010d38ce
Cómo Funciona ⚙️
Motor 1 — Proyección Monte Carlo 🎲
El indicador analiza el historial reciente de precios y extrae retornos logarítmicos. Calcula el retorno promedio y su desviación estándar — capturando tanto el drift (tendencia) como la volatilidad (movimiento errático) 🌪️.
Ejecuta 200 caminos de precio simulados (hasta 500) hacia el futuro. Cada simulación es una "caminata aleatoria" basada en la acción real reciente. De estos, el indicador extrae 5 bandas percentiles:
Banda
Significado
95%
Extremo optimista — solo el 5% de las simulaciones fueron más altas 🚀
75%
Rango probable superior — el precio terminó por encima de esto en el 25% de las simulaciones 📈
50% (MD)
Proyección mediana — el centro estadístico de todos los resultados 🎯
25%
Rango probable inferior — el precio terminó por debajo de esto en el 25% de las simulaciones 📉
05%
Extremo pesimista — solo el 5% de las simulaciones fueron más bajas 📉🛑
Consejo Profesional: Cuanto más se abra el abanico, mayor es la volatilidad actual 📢. Un abanico estrecho significa que el activo se mueve de manera predecible 🧵.
Motor 2 — Clasificador Bayesiano 🧠
Independiente de la proyección, este motor clasifica el mercado como alcista o bajista mediante:
- Revisar una ventana (por defecto 500 barras) 🔍.
- Medir volumen relativo y momentum para barras alcistas vs. bajistas.
- Calcular a qué perfil se ajusta mejor la barra actual usando probabilidad gaussiana ⚖️.
El resultado es un porcentaje de probabilidad de ganar:
Probabilidad
Interpretación
> 70%
Alta confianza alcista ✅🟢
50–70%
Moderado / poco claro ⚖️🟡
< 30%
Alta confianza bajista ✅🔴
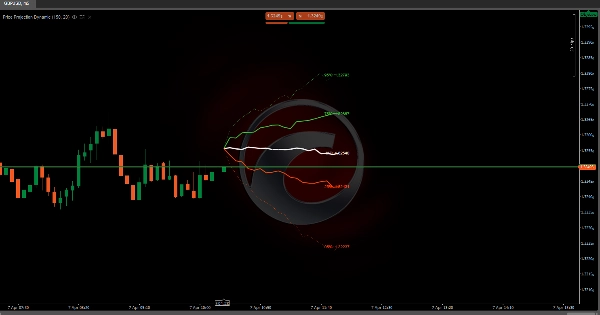
Elementos Visuales 🎨
- Líneas verdes (75%, 95%): Bandas superiores de proyección — rango alcista 🍏
- Línea blanca (MD): Precio proyectado mediano — camino más probable 🏁
- Líneas naranjas (25%, 05%): Bandas inferiores de proyección — rango bajista 🍊
- Líneas exteriores punteadas: Extremos 95% y 05% (límites de baja probabilidad) ⚠️
- Líneas interiores sólidas: 75%, 50%, 25% (zona de alta probabilidad) ✅
- Etiquetas de precio: Precio proyectado exacto para cada percentil 🏷️
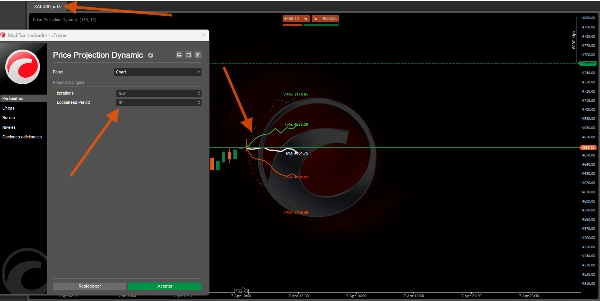
- Panel de información (arriba a la derecha): Probabilidad de ganar bayesiana, objetivo mediano, volumen relativo, dirección de la señal 🖥️
Cómo Usar 📖
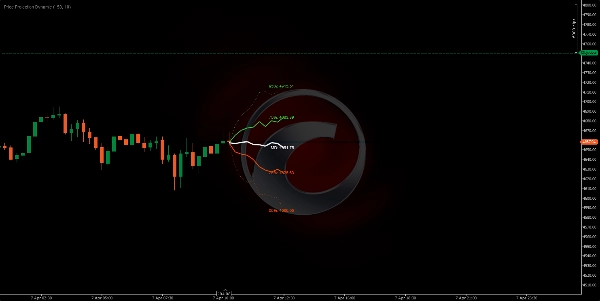
- Leer la forma del abanico 📢 — Si se expande rápidamente, la volatilidad es alta y las proyecciones son menos ciertas.
- Usar la línea mediana (MD) 🎯 como el objetivo de precio futuro estadísticamente más probable.
- Usar las bandas 75%/25% 📏 como objetivos superiores/inferiores realistas para operaciones.
- Usar las bandas 95%/05% 🛑 como límites extremos — útil para colocar stop loss.
- Revisar el panel bayesiano 🧠 — Una probabilidad superior al 70% o inferior al 30% añade convicción direccional.
- Combinar ambos motores 🤝 — Si la línea mediana tiene pendiente ascendente Y la probabilidad bayesiana es > 70%, la configuración es estadísticamente fuerte.
Parámetros Clave ⚙️
Parámetro
Qué Controla
Valor Más Alto
Valor Más Bajo
Iteraciones
Número de caminos simulados
Bandas más suaves 🌊
Cálculo más rápido ⚡
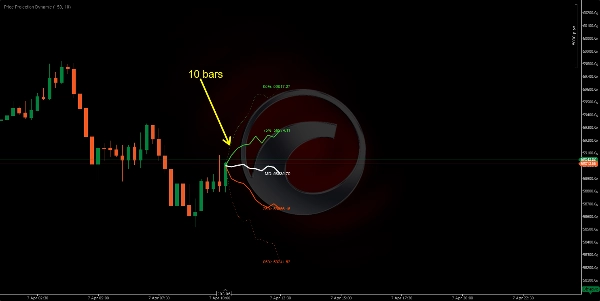
Anticipación
Distancia de proyección futura
Horizonte más largo 🔭
Más corto, más confiable 🔍
Profundidad de Muestra
Barras recientes para analizar
Comportamiento a largo plazo 🐢
Solo comportamiento reciente 🐇
Ventana del Clasificador
Historial bayesiano
Probabilidad más estable ⚖️
Más reactivo ⚡
Perfil del Indicador 📋
- Categoría del indicador: Estadísticas 📊
- Tipo de salida: Visualización y Señales 🖼️
- Requisitos de datos: Solo barras 📶
Descargo de responsabilidad ⚠️
Este indicador proyecta probabilidades estadísticas, no predicciones 🔮. Las simulaciones Monte Carlo asumen que el futuro se parecerá al pasado reciente — esto falla durante eventos cisne negro 🦢 o gaps impulsados por noticias. Úselo como un marco probabilístico junto con su propia gestión de riesgos 🛡️.
Resumen
Separately, the Bayesian classifier evaluates market sentiment by analyzing relative volume and momentum over a configurable window, providing a win probability percentage that indicates bullish or bearish confidence. Visual elements include color-coded projection bands (green for bullish, orange for bearish), a median price line, price labels for each percentile, and an info panel displaying Bayesian probability and other metrics.
Key adjustable parameters include the number of simulation iterations, projection horizon, sample depth of historical bars, and classifier window size. The indicator requires bar data with volume and outputs visual projections and directional signals. It is designed to offer a probabilistic framework for anticipating price movement based on recent market behavior, suitable for various symbols including BTCUSD, EURUSD, GBPUSD, XAUUSD, NAS100, and others.
Valoraciones de clientes
5 | 0 % | |
4 | 100 % | |
3 | 0 % | |
2 | 0 % | |
1 | 0 % |


