Açıklama
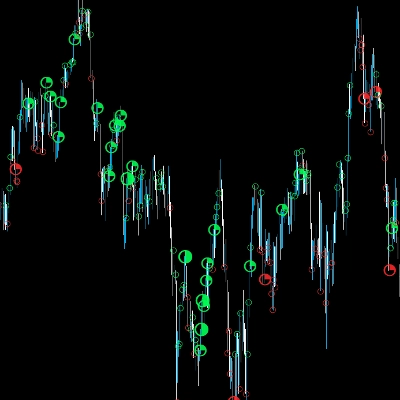
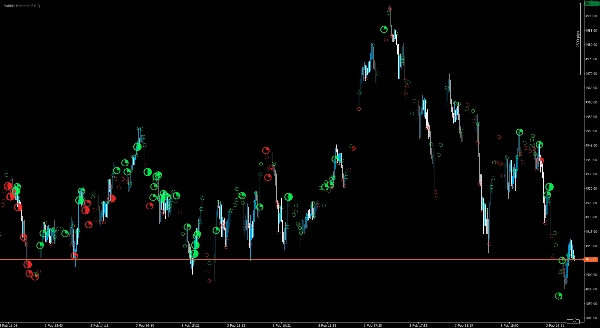
Delta Peak Bubbles, piyasa “nerede çalışıyor” tick grafiklerinde hızlı ve görsel bir şekilde tanımlamak isteyen tüccarlar için tasarlanmıştır. Ekranınızı ekstra panellerle doldurmak yerine, yüksek yoğunluklu aktivite patlamalarını gerçek zamanlı olarak ortaya çıkarmak için grafiğin üzerine net, derecelendirilmiş baloncuklar çizer.
Gösterge, her bar içindeki zirve anlarına odaklanır ve bunları kolay okunabilir bir güç ölçeğiyle görselleştirir (hafif dairelerden en güçlü olaylar için öne çıkan bir yıldıza kadar). Baloncuklar, hızlı yönsel bağlam için renk kodludur, böylece boğa ve ayı baskısını bir bakışta ayırt etmek kolaydır.
Pratik ticaret iş akışları için tasarlanan Delta Peak Bubbles özellikle şu durumlarda iyi çalışır:
- Skalping ve kısa vadeli momentum ticareti
- Kırılma onayı ve ivme takibi
- Tepki bölgelerinin ve potansiyel tükenme noktalarının belirlenmesi
- Fiyat Hareketi / SMC / ana seviye stratejilerine “ısı katmanı” eklemek
Baloncuk güç rehberi
Baloncuklar, normal aktiviteyi yüksek etkili sıçramalardan hızlıca ayırmanıza yardımcı olmak için dört güç seviyesine ayrılmıştır:
- Seviye 1 – Düşük:
○(küçük sıçrama) - Seviye 2 – Orta:
◔(orta sıçrama) - Seviye 3 – Yüksek:
◑(güçlü sıçrama) - Seviye 4 – Aşırı:
★(çok güçlü / öne çıkan sıçrama)
Renk, yönsel baskıyı gösterir (yeşil = boğa, kırmızı = ayı).
Görüntüleme kontrolleri, 4K monitörler dahil her düzeni temiz tutar, böylece önemli anları görürken grafiğinizi okunabilir tutabilirsiniz.
Feragatname: Ticaret/Yatırım önemli riskler içerir ve yatırılan tüm sermayenin kaybına yol açabilir. Bu gösterge yalnızca bilgilendirme ve analiz amaçlıdır ve finansal tavsiye, teklif veya öneri teşkil etmez. Kullanım kendi riskinizdedir; tüm ticaret kararları ve sonuçlarından yalnızca siz sorumlusunuz. Sağlayıcı, doğruluk, eksiksizlik, zamanlama, performans, ticari uygunluk veya belirli bir amaca uygunluk konusunda açık veya zımni herhangi bir beyan veya garanti vermez. Kanunun izin verdiği en geniş ölçüde, sağlayıcı bu göstergenin kullanımıyla ilgili doğrudan veya dolaylı zararlar, kayıplar veya kar kayıpları için sorumlu tutulamaz (piyasa koşulları, veri/platform sorunları, yapılandırma hataları veya yanlış kullanım nedeniyle oluşan kayıplar dahil ancak bunlarla sınırlı olmamak üzere). Geçmiş performans, gelecekteki sonuçlar için güvenilir bir gösterge değildir.
Özet
Müşteri değerlendirmeleri
5 | 33 % | |
4 | 67 % | |
3 | 0 % | |
2 | 0 % | |
1 | 0 % |