
Penerangan
🎯 MAKLUMAT VOLATILITI PELBAGAI RANGKAIAN MASA
Berhenti Terlepas Pecahan Volatiliti - Lihat Setiap Rangka Masa Serentak
Kebanyakan penunjuk volatiliti hanya menunjukkan satu perspektif sahaja. Penunjuk Volatiliti Bergulung Pelbagai Rangka Masa memberikan anda gambaran lengkap merentasi tempoh jangka pendek (7), jangka sederhana (21), dan jangka panjang (63) - dengan isyarat dagangan terbina dalam yang memberitahu anda bila untuk bertindak.
⚡ MENGAPA VOLATILITI PELBAGAI RANGKAIAN MASA MENGUBAH SEGALANYA
Rangka Masa Tunggal vs Pendekatan Pelbagai Rangka Masa Kami:
- ❌ Tempoh Tunggal: Anda nampak pokok tetapi terlepas hutan
- ✅ Tiga Tempoh: Lanskap volatiliti lengkap dengan konteks
Senario Dagangan Sebenar:
- Lonjakan jangka pendek semasa ketenangan jangka panjang → Bunyi sementara (abaikan)
- Semua rangka masa meningkat → Perubahan rejim sebenar (bertindak)
- Ketenangan jangka pendek di tengah kekacauan jangka panjang → Ketenangan palsu (berhati-hati)
🎯 CIRI PROFESIONAL
✨ KETERLIHATAN TRIPLE RANGKAIAN MASA
- StdDev 7: Tangkap perubahan volatiliti segera (intrahari)
- StdDev 21: Volatiliti jangka sederhana (dagangan ayun)
- StdDev 63: Konteks volatiliti jangka panjang (dagangan posisi)
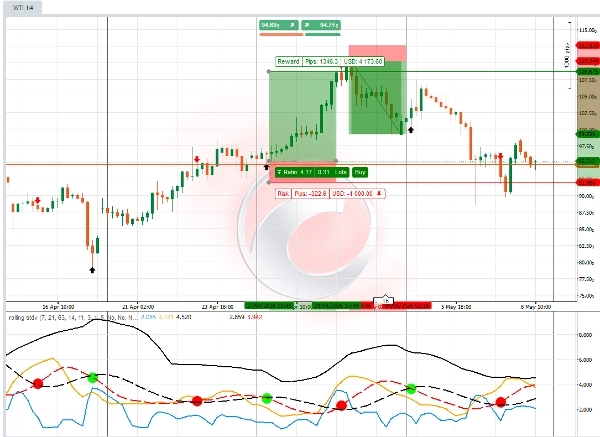
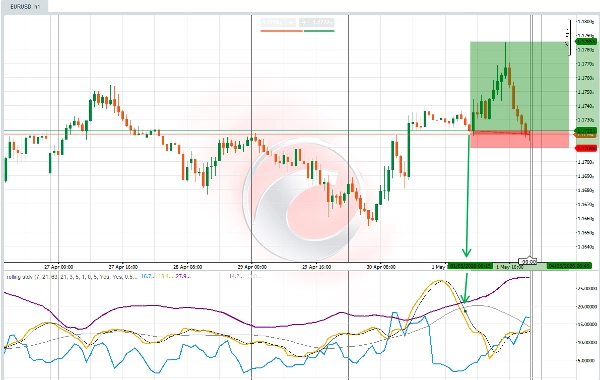
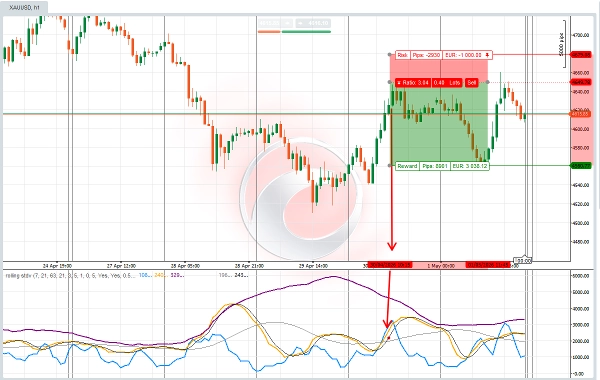
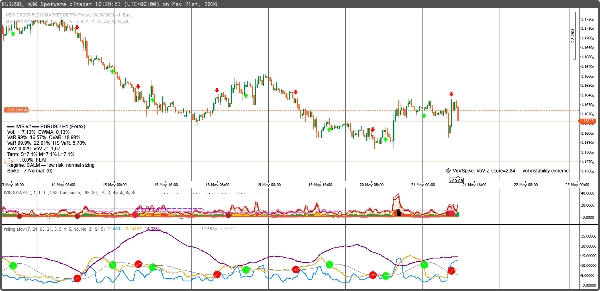
- Isyarat osilator: apabila purata garis isyarat Sisihan Piawai Bergulung bersilang, titik berwarna mengesahkan volatiliti lebih tinggi dan lebih rendah serta arah tindakan harga. Dengan isyarat Titik Merah dan Titik Hijau yang besar, Pedagang juga akan melihat isyarat Anak Panah Merah dan Anak Panah Hijau pada carta, yang boleh membantu menentukan tahap kemasukan dan saiz dagangan.
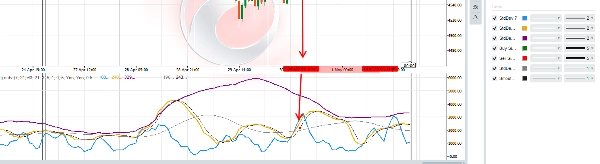
- Sisihan Piawai Bergulung adalah osilator volatiliti dengan logik isyarat pasaran ramalan. Parameter pada panel perlu diperiksa dan disesuaikan mengikut jenis instrumen CFD yang ingin didagangkan oleh pedagang. Setiap instrumen Aset Kewangan CFD boleh mempunyai tetapan panel yang sedikit berbeza. Pedagang boleh memilih ketepatan dan ketelitian bacaan volatiliti dengan mengaktifkan: Cerun, Isyarat silang Pantas/Sederhana, dan Pelicinan.
📊 ANALISIS VOLATILITI LANJUTAN
- Persilangan Volatiliti: Garis StdDev bersilang = perubahan rejim
- Isyarat Pembalikan Purata: Volatiliti kembali ke purata
- Pengesanan Lonjakan: Peristiwa volatiliti melampau
💡 SESUAI UNTUK GAYA DAGANGAN INI:
🎯 Pedagang Pecahan Volatiliti
- Masuk semasa volatiliti rendah sebelum pergerakan meletup
- Keluar semasa volatiliti tinggi sebelum pembalikan
- Masa kemasukan dengan ketepatan menggunakan pengesahan tiga kali
📈 Pedagang Pembalikan Purata
- Redamkan ekstrem volatiliti dengan yakin
- Kenal pasti keadaan pasaran yang terlalu melampau
- Gunakan volatiliti sebagai penunjuk bertentangan
🛡 Pedagang Berhati-hati Risiko
- Elakkan tempoh volatiliti tinggi sepenuhnya
- Dagangan hanya semasa pasaran tenang dan boleh diramal
- Gunakan volatiliti sebagai panduan saiz posisi
📊 Pedagang Opsyen
- Jual premium masa semasa volatiliti tinggi
- Beli opsyen semasa pemampatan volatiliti
- Analisis IV vs HV untuk penetapan harga salah
Isyarat Pintar Terbina:
- ✅ Beli apabila: Volatiliti jatuh di bawah ambang ATAU melintasi di bawah purata bergerak
- ✅ Jual apabila: Volatiliti melonjak di atas ambang ATAU melintasi di atas purata bergerak
📈 APA YANG ANDA DAPAT:
✅ Keterlihatan Triple Rangka Masa - Tiada lagi meneka konteks volatiliti
✅ Isyarat Beli/Jual Automatik - Anak panah visual jelas pada titik optimum
✅ Pengesanan Rejim Volatiliti - Tahu bila pasaran tenang atau kacau-bilau
✅ Ambang Boleh Disesuaikan - Sesuaikan dengan mana-mana gaya dagangan atau aset
✅ Kod Warna Profesional - Kefahaman visual segera
💰 HARGA PELANCARAN ISTIMEWA: $50
(Harga biasa: $100)
Pecahan Nilai:
- Penunjuk StdDev 7: nilai $29
- Penunjuk StdDev 21: nilai $29
- Penunjuk StdDev 63: nilai $29
- Isyarat Dagangan: nilai $49
- Jumlah Nilai: $136
- Harga Anda: $50 (Jimat 35%)
Termasuk: Penunjuk penuh Warna
🎁 BONUS: Panduan Masa Volatiliti Percuma
Pembelian termasuk "Penguasaan Volatiliti Pelbagai Rangka Masa" - bernilai $39 PERCUMA.
Termasuk:
- Strategi dagangan mampatan volatiliti
- Teknik pengesahan pelbagai rangka masa
- Pengurusan risiko untuk tempoh volatil
- Contoh dagangan dunia sebenar
🚀 SEDIA UNTUK MENGUASAI MASA VOLATILITI?
Klik "Tambah ke Troli" dan ubah cara anda melihat dan berdagang volatiliti pasaran.
"Saya telah mencuba setiap penunjuk volatiliti yang ada. Pendekatan triple rangka masa dengan isyarat terbina dalam ini adalah apa yang saya gunakan setiap hari dalam dagangan firma prop saya."
- Sarah Rodriguez, Pedagang Swing Profesional
SESUAI UNTUK PASARAN INI:
📊 Saham & ETF
- Penentuan masa volatiliti SPY, QQQ
- Putaran sektor berdasarkan volatiliti
- Permainan volatiliti pendapatan
💹 Pasangan Forex
- Analisis volatiliti pasangan utama
- Penilaian risiko dagangan carry
- Pengesahan pecahan
📈 Komoditi
- Kitaran volatiliti emas
- Lonjakan volatiliti minyak
- Volatiliti bermusim pertanian
🔄 Kriptowang
- Rejim volatiliti BTC/ETH
- Peluang volatiliti altcoin
- Pengurusan risiko dalam kripto
Kesimpulan: Ini bukan sekadar penunjuk sisihan piawai biasa. Ia adalah sistem masa volatiliti lengkap yang menunjukkan dengan tepat bila pasaran akan bergerak.
Tawaran Pelancaran Terhad: 150 salinan pertama pada $89 (jimat $30)
"Perbezaan antara dagangan amatur dan profesional sering bergantung pada masa volatiliti. Penunjuk ini menutup jurang itu."
Tambah ke Troli Sekarang → Mula Berdagang Volatiliti Seperti Profesional.
Ringkasan
Key features include:
- Triple timeframe visibility for immediate, swing, and position trading contexts.
- Volatility crossovers signaling regime shifts.
- Mean reversion and spike detection for volatility extremes.
- Customizable parameters to adapt to different CFD instruments and trading styles.
- Professional color-coded signals for quick interpretation.
This indicator suits various trading styles, including volatility breakout, mean reversion, risk-averse, and options trading. It supports multiple markets such as stocks, ETFs, forex pairs, commodities, and cryptocurrencies, providing volatility timing insights for assets like SPY, QQQ, gold, oil, BTC, and ETH.
Included with the indicator is a volatility timing guide covering compression strategies, multi-timeframe confirmation, risk management, and real trade examples. The tool requires tick data and outputs actionable signals to enhance volatility-based trading decisions.
Ulasan pelanggan
5 | 50 % | |
4 | 50 % | |
3 | 0 % | |
2 | 0 % | |
1 | 0 % |


