
VA Footprint
Wskaźnik
2 zakupy
Wersja 2.0, May 2026
Windows, Mac
4.5
Opinie: 4
Opis
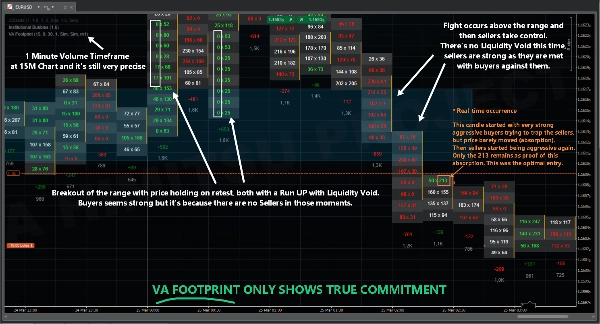
VA Footprint grupuje agresję według klastrów ticków, eliminując potrzebę odwoływania się do różnych poziomów. Ta struktura zapewnia również odporność na spoofing HFT (takie jak wash trading lub agresywne zlecenia wymieszane z szumem, mające na celu ukrycie intencji na poziomie bid x ask). Ponieważ mierzy zaangażowanie na klastrach składających się z 10 lub więcej ticków, trudno i kosztownie jest dla instytucjonalnej aktywności ukryć swoje ślady.
Regulowane Parametry (Istotne Ustawienia)
- Czas trwania pudełka (minuty) --> Dostosuj do ram czasowych swojego wykresu
- Rozmiar poziomu (%)
- Tryb ciemny (true/false)
- Pokaż obszar wartości (true/false)
- Ram czasowy wolumenu (10-ticków, 50-ticków)
Ważne Uwagi
- MARKET REPLAY z precyzją ticków działa, możesz go użyć do testowania swojej strategii i sprawdzania wskaźnika przez dłuższe okresy.
- Zwiększenie poziomu ticków dodaje precyzji, zbyt duże zmniejszenie obniży dokładność, zaleca się co najmniej 0.10.
Podsumowanie
Podsumowanie AI
VA Footprint is an order flow indicator that replaces traditional charts with a detailed footprint view, enabling precise market reading. It groups aggressive trading activity by clusters of ticks (typically 10 or more), reducing the need to cross-reference price levels and providing resilience against high-frequency trading spoofing tactics such as wash trading or disguised aggressive orders. This clustering approach makes it difficult for institutional activity to conceal their market footprints.
Key adjustable parameters include box duration (to align with chart timeframe), level size percentage, dark mode toggle, value area display, and volume timeframe selection (e.g., 10-tick or 50-tick clusters). The indicator supports market replay with tick precision, allowing users to backtest strategies over extended periods.
VA Footprint is applicable across multiple markets including Forex, indices, and stocks, and supports trading strategies such as scalping and smart money concepts. It provides visualizations, signals for divergences, breakouts, reversals, trend strength, volatility regimes, and level breaks, relying on tick data, bars, and volume inputs. This tool is designed to enhance market structure analysis and order flow understanding for traders.
Profil wskaźnika
Kategoria wskaźnika
Przepływ zleceń / GłR
Typ wyjścia
Wizualizacja
Sygnały
Filtr
Wymagania dotyczące danych
Dane tickowe
Tylko słupki
Wolumen
Obsługiwane sygnały
Dywergencja
Przełamanie
Odwrócenie trendu
Siła trendu
Zmienność
Przebicie poziomu
Opinie klientów
4.5
Opinie: 4
5 | 50 % | |
4 | 50 % | |
3 | 0 % | |
2 | 0 % | |
1 | 0 % |
Opinie klientów
April 10, 2026
A decent setup here should survive 1 percent risk without looking messy. The first month should show both ROI and DD. The next review on it on 30 trades.
April 4, 2026
For risk management, this feels more useful as a filter than a full system. The journal should cover 76 setups and the trade context.
April 4, 2026
The stats tell the story. Tracking 1 percent risk first, compare the result with BE after 1R, and only scale if 1.5R partials still looks controlled.
March 31, 2026
Feels right for a user who wants less noise in the process. The best use is sizing and stop planning, then leaving the final filter manual. The problem appears when the tool makes weak ideas look acceptable.5R partials.
Dyskusja
Częste pytania
Prop
Forex
Scalping
Indices
SMC
Stocks
Market Structure
Produkty dostępne za pośrednictwem cTrader Store, w tym boty handlowe, wskaźniki i wtyczki, dostarczane są przez deweloperów zewnętrznych i udostępniane wyłącznie w celach informacyjnych oraz w celu zapewnienia dostępu technicznego. cTrader Store nie jest brokerem i nie zapewnia doradztwa inwestycyjnego, nie udziela spersonalizowanych rekomendacji ani nie gwarantuje przyszłych wyników.
Więcej od tego autora


![Logo „[Hamster-Coder] Moving Average MTF”](https://cdn.ctrader.com/image/webp/b11b98b1-194d-4b8e-b00e-d611826ad159_31226)
Cena
Od 24/03/2026
10
Sprzedaż
62
Bezpłatne instalacje