
HA
مؤشر
2 عمليات الشراء
الإصدار 1.0، Jan 2026
Windows, Mac
4.0
التقييمات: 1
الوصف
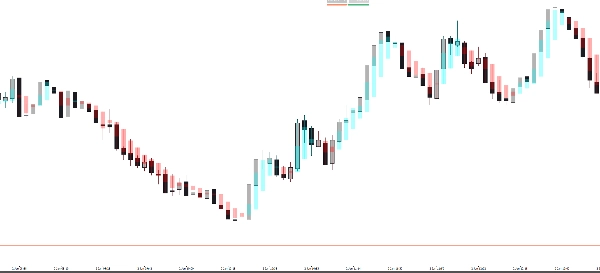
الPro Heikin Ashi Visual Overlay هو الأداة المثالية للمتداولين الذين يرغبون في الاستفادة من فوائد تنعيم الاتجاه لشموع Heikin Ashi مع الحفاظ على مخططات الشموع أو الأعمدة القياسية نشطة.
تتطلب مخططات Heikin Ashi التقليدية منك تغيير نوع المخطط بالكامل، مما يصعب رؤية حركة السعر الدقيقة. يحل هذا المؤشر هذه المشكلة عن طريق رسم شموع Heikin Ashi كـ طبقة شفافة جزئياً، مما يتيح لك اكتشاف انعكاسات الاتجاه وزخم السوق فوراً دون فقدان رؤية السعر الحقيقي.
لماذا تستخدم هذه الطبقة؟
- 💎 تقليل الضوضاء: يقوم Heikin Ashi بتصفية ضوضاء السوق، مما يسهل البقاء في الصفقات الرابحة.
- 🕯️ عرض المخطط المزدوج: احتفظ بالشموع القياسية لحركة السعر/الأنماط أثناء استخدام طبقة HA لاتجاه الاتجاه.
- 🎨 قابل للتخصيص بالكامل: قم بضبط الشفافية والألوان لتتناسب مع مساحة عملك (الوضع الداكن أو الفاتح).
- 🚀 تحديد الاتجاه الفوري: تساعد المناطق الزرقاء (صعودية) والحمراء (هبوطية) على تجنب التداول عكس الزخم.
الميزات الرئيسية:
- شفافية ذكية: قم بضبط الشفافية بحيث لا تخفي الطبقة حركة السعر الرئيسية.
- محاذاة مثالية: محسوبة في الوقت الحقيقي لتتوافق مع قيم Heikin Ashi للإطار الزمني الحالي.
- تصميم احترافي: صور نظيفة لا تزدحم مخططك.
- شامل: يعمل على جميع الأطر الزمنية (M1 إلى شهري) وجميع الأصول (الفوركس، الأسهم، العملات المشفرة، المؤشرات).
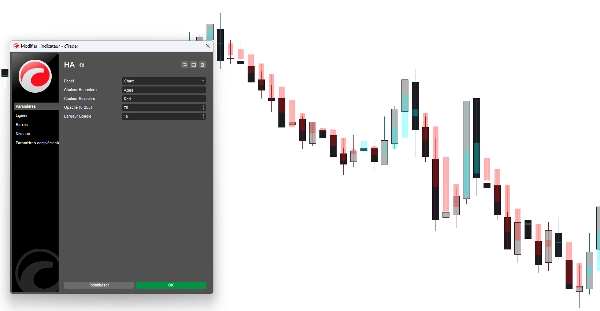
كيفية استخدامه:
- قم بتطبيق المؤشر على مخططك.
- اضبط الشفافية و عرض الجسم في الإعدادات حسب تفضيلك.
- استخدم شموع HA لتأكيد قوة الاتجاه:
-
- فتائل طويلة في اتجاه الاتجاه = زخم قوي.
- أجسام صغيرة مع فتائل على الجانبين = احتمال انعكاس.
المعلمات:
- لون صعودي: لون مخصص لشموع HA الصاعدة.
- لون هبوطي: لون مخصص لشموع HA الهابطة.
- الشفافية (0-255): تحكم في مدى ظهور الشموع "كالأشباح" أو صلبة.
- عرض الشمعة: اضبط سمك شموع HA لتناسب مستوى التكبير الخاص بك تمامًا.
الملخص
ملخص الذكاء الاصطناعي
The Pro Heikin Ashi Visual Overlay is an indicator designed to enhance trend analysis by overlaying Heikin Ashi candles on standard candlestick or bar charts. Unlike traditional Heikin Ashi charts that replace the entire chart type, this tool provides a semi-transparent overlay, allowing traders to observe smoothed trend signals while retaining visibility of actual price action.
Key features include noise reduction to filter market fluctuations, customizable opacity and colors for integration with different chart backgrounds, and real-time alignment with the current timeframe’s Heikin Ashi calculations. The overlay uses blue and red zones to indicate bullish and bearish trends, aiding in immediate trend identification. It supports all timeframes from one minute to monthly and is compatible with various asset classes including Forex, stocks, cryptocurrencies, commodities, and indices.
Users can adjust candle width and opacity to suit their chart zoom level and visual preferences. The indicator facilitates dual-chart viewing, enabling simultaneous analysis of precise price patterns and smoothed trend momentum. It is designed with clean visuals to avoid chart clutter and supports professional trading environments.
ملف تعريف المؤشر
تقييمات العملاء
4.0
التقييمات: 1
5 | 0 % | |
4 | 100 % | |
3 | 0 % | |
2 | 0 % | |
1 | 0 % |
مناقشة
الأسئلة الشائعة
Forex
Signal
Indices
Commodities
Crypto
Stocks
يتم توفير المنتجات المتاحة من خلال cTrader Store، بما في ذلك روبوتات التداول والمؤشرات والإضافات، من قبل مطوري الطرف الثالث وإتاحتها لأغراض الوصول المعلوماتي والفني فقط. cTrader Store ليس وسيطًا ولا يقدم نصائح استثمارية أو توصيات شخصية أو أي ضمان للأداء المستقبلي.
المزيد من هذا المؤلف


السعر
منذ 27/10/2025
10
المبيعات