
Opis
Koncepcja "Inżynierii Wstecznej"
Główną innowacją tego wskaźnika jest jego algorytm Inżynierii Wstecznej. Zazwyczaj oscylator stochastyczny pobiera dane cenowe i przekształca je w liczbę między 0 a 100. Ten wskaźnik robi odwrotnie: bierze matematyczne poziomy oscylatora i przekształca je z powrotem na skalę cenową.
Pozwala to traderowi przetłumaczyć matematyczny impet na konkretny poziom cenowy (w $ lub pipsach) bezpośrednio na wykresie.
Definiowanie Granic: Sufit (99%) i Podłoga (1%)
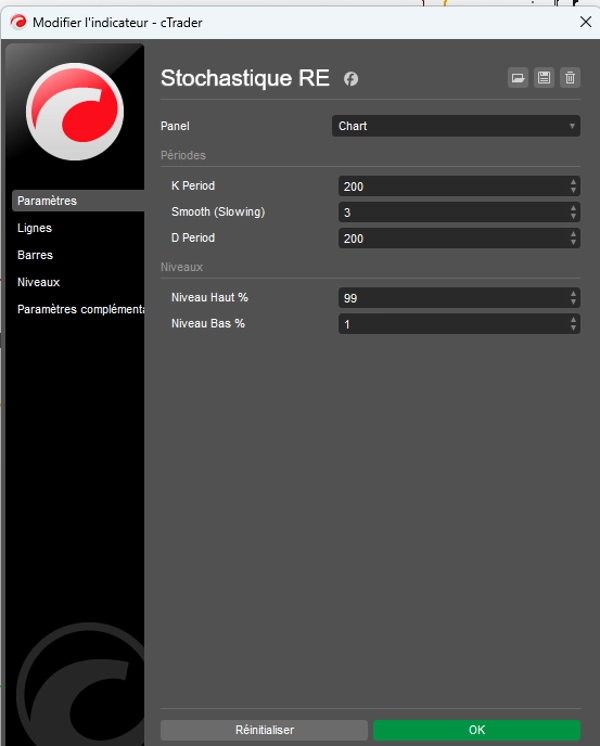
W przeciwieństwie do klasycznych ustawień (80/20), ten wskaźnik jest domyślnie ustawiony na 1% i 99%. Ta konfiguracja ma określony cel: definiuje fizyczne granice ceny.
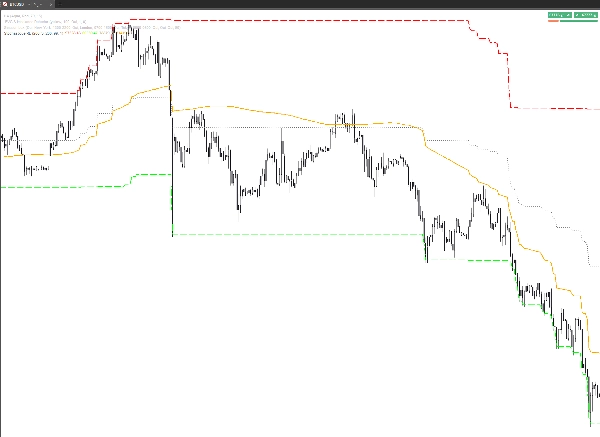
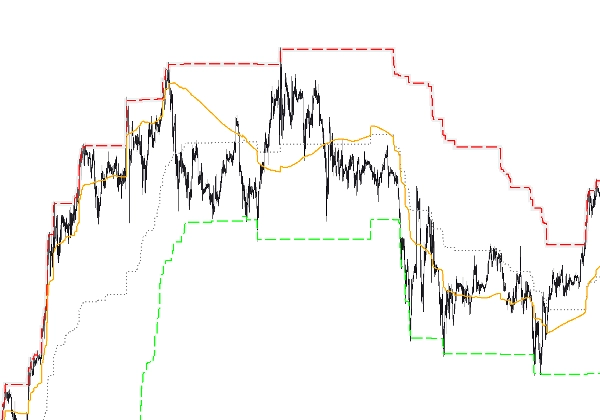
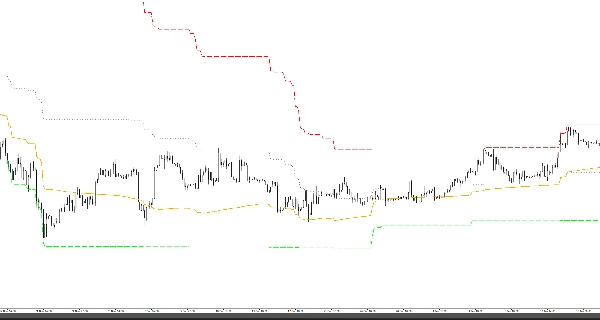
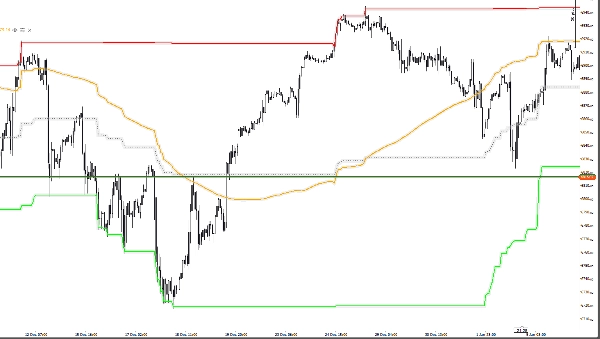
- Poziom 99% (Sufit cenowy): Określa najwyższą cenę, jaką rynek może osiągnąć, zanim uzna się, że wyczerpał 99% amplitudy ruchu w danym okresie. Jest to "granica" ceny.
- Poziom 1% (Podłoga cenowa): Określa najniższą cenę, ostateczne wsparcie bieżącego cyklu. Jest to poziom, na którym cena wyczerpała 99% swojej zdolności spadkowej względem niedawnej historii.
Dlaczego "Definiuje Cenę"?
Dzięki temu systemowi linia Pomarańczowego Sygnału %D nie jest już tylko krzywą poruszającą się w próżni.
- Lokalizacja Ceny: Pokazuje dokładne położenie "uczciwej ceny" ważonej jej impetem.
- Mapowanie Zakresu: Przekształca wykres w mapę, na której można zobaczyć, czy bieżąca cena "jest warta" 1% czy 99% swojego potencjału.
- Konkretne Cele: Jeśli pomarańczowa linia przesuwa się w górę, nie dąży tylko do osiągnięcia "80"; dąży do osiągnięcia dokładnej ceny pokazywanej przez czerwoną linię (99%).
Funkcje Linii (Zakładka Linie)
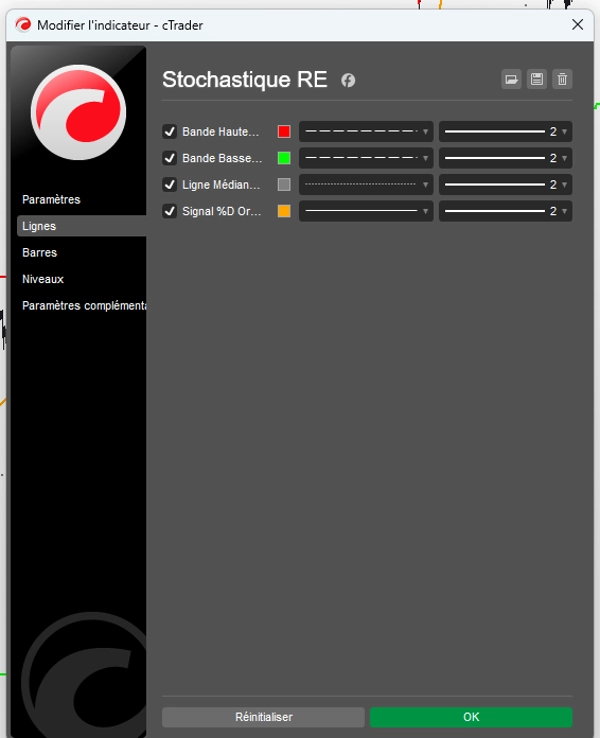
Wszystko jest konfigurowalne dla natychmiastowego odczytu wizualnego:
- Górna Granica (99%): Teoretyczny sufit cenowy.
- Dolna Granica (1%): Teoretyczna podłoga cenowa.
- Linia Środkowa (50%): Centralny punkt obrotu, strefa równowagi.
- Pomarańczowy Sygnał %D: Dynamiczny kursor poruszający się między podłogą a sufitem, definiujący kierunek rynku.
Podsumowanie dla Tradera
Ten wskaźnik nie tylko mówi, że rynek jest "przekupiony"; pokazuje dokładnie przy jakiej cenie rynek staje się fizycznie zbyt drogi (99%) lub zbyt tani (1%). To narzędzie precyzyjne, które sprowadza matematykę z powrotem do rzeczywistości księgi zleceń.
Podsumowanie
The indicator displays these boundaries directly on the price chart, allowing traders to see exact price levels where the market is considered overbought or oversold. Key features include customizable lines for the upper band (99%), lower band (1%), mid line (50%), and an orange signal %D line that dynamically indicates market direction between these boundaries.
By translating momentum into precise price targets, Stochastique RE helps traders localize fair price zones, map price ranges, and identify concrete price targets rather than abstract oscillator values. It supports various markets including Forex, stocks, commodities, indices, and cryptocurrencies, with symbol tags such as BTCUSD, EURUSD, GBPUSD, XAUUSD, NAS100, and USDJPY.
Opinie klientów
5 | 67 % | |
4 | 33 % | |
3 | 0 % | |
2 | 0 % | |
1 | 0 % |


