
CCI - With Arrows and 40 80 EMA Logic_noSourceCode
Indicatore
2 acquisti
Versione 1.0, Feb 2025
Windows, Mac
5.0
Recensioni: 1
Descrizione
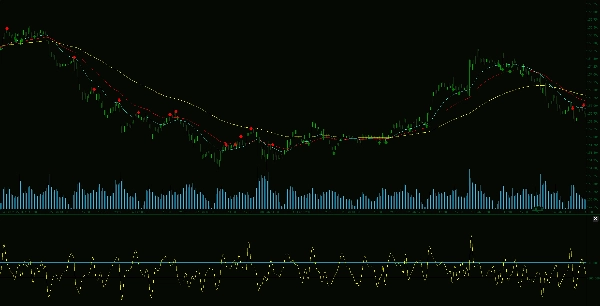
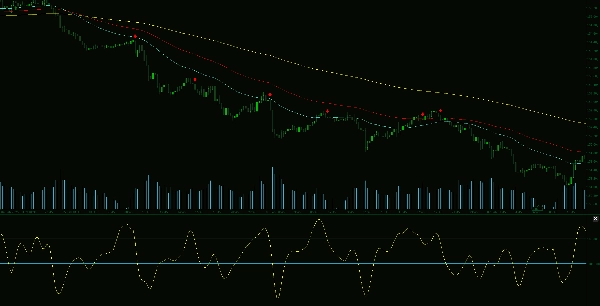
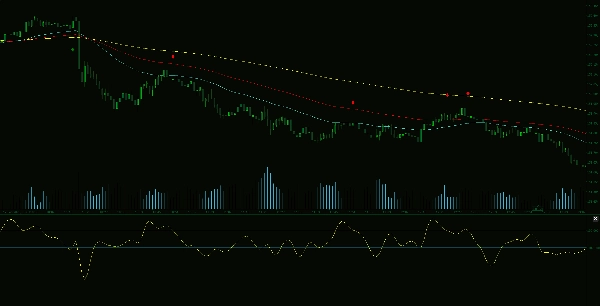
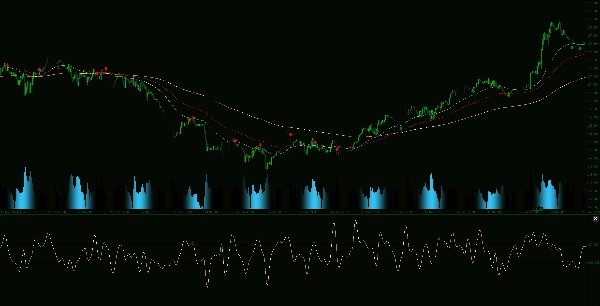
L'Indicatore Avanzato CCI & EMA è uno strumento di trading potente che migliora l'analisi delle tendenze combinando il Commodity Channel Index (CCI) con la logica EMA a 40 e 80. Questo approccio sofisticato genera frecce che indicano potenziali movimenti di prezzo, aiutando i trader a identificare opportunità di trading ad alta probabilità.
Caratteristiche principali:
Riepilogo
Riepilogo AI
The Advanced CCI & EMA Indicator integrates the Commodity Channel Index (CCI) with 40 and 80-period Exponential Moving Averages (EMAs) to enhance trend analysis and momentum detection. It generates clear buy and sell arrows on the chart, signaling potential price movements based on combined momentum and trend confirmation. Key features include CCI-based identification of overbought and oversold conditions, EMA logic to confirm trend direction and filter weak signals, and customizable settings to adapt to various trading strategies and timeframes. This indicator supports traders in aligning with prevailing market trends and improving timing by reducing false reversal signals. It is suitable for use on indices and commodities markets.
Profilo indicatore
Recensioni dei clienti
5.0
Recensioni: 1
5 | 100 % | |
4 | 0 % | |
3 | 0 % | |
2 | 0 % | |
1 | 0 % |
Recensioni dei clienti
February 25, 2025
half size is enough at the start. Low quality setups lose some appeal.
Discussioni
Domande frequenti
Indices
Commodities
I prodotti disponibili tramite cTrader Store, inclusi bot di trading, indicatori e plugin, sono forniti da sviluppatori terzi e resi disponibili esclusivamente a scopo informativo e di accesso tecnico. cTrader Store non è un broker e non fornisce consulenze in materia di investimento, raccomandazioni individualizzate o garanzie di risultati futuri.


Prezzo
Da 14/01/2025
55
Vendite
11.44K
Installazioni gratuite