
HTFBB
Wskaźnik
1 zakupy
Wersja 1.0, Jul 2025
Windows, Mac
5.0
Opinie: 1
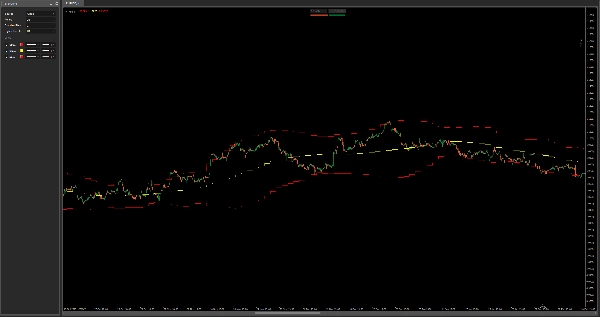
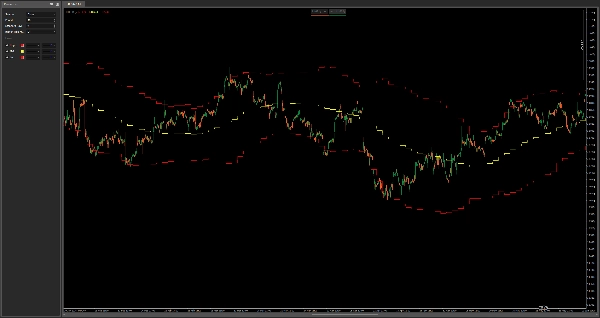
HTF Bollinger Bands – Wieloczasowa Mapa Zmienności
Ten wskaźnik rysuje wstęgi Bollingera z wyższego interwału czasowego na Twoim aktualnym wykresie, dając Ci potężny kontekst zmienności, powrotu do średniej oraz dynamicznego wsparcia/oporu — wszystko bez zmiany interwałów czasowych.
Funkcje:
- Wyświetla górne, środkowe i dolne wstęgi Bollingera z dowolnego wybranego wyższego interwału czasowego
- Świetny do wykrywania stref konsolidacji HTF, presji na wybicie oraz cofnięć trendu
- Idealny do skalpowania i wejść intraday z uwzględnieniem wyższego interwału czasowego
- Działa na wszystkich aktywach i interwałach czasowych
Połącz z Twoją obecną strategią, aby unikać pułapek zmienności i pozostawać zgodnym z makrostrukturą cenową.
Profil wskaźnika
5.0
Opinie: 1
5 | 100 % | |
4 | 0 % | |
3 | 0 % | |
2 | 0 % | |
1 | 0 % |
Opinie klientów
July 29, 2025
confusing signals get easier to ignore, but a clean signal can still fail.
Produkty dostępne za pośrednictwem cTrader Store, w tym boty handlowe, wskaźniki i wtyczki, dostarczane są przez deweloperów zewnętrznych i udostępniane wyłącznie w celach informacyjnych oraz w celu zapewnienia dostępu technicznego. cTrader Store nie jest brokerem i nie zapewnia doradztwa inwestycyjnego, nie udziela spersonalizowanych rekomendacji ani nie gwarantuje przyszłych wyników.


Od 03/01/2025
638.03K
Wolumen transakcji
21.34K
Zysk w pipsach
15
Sprzedaż