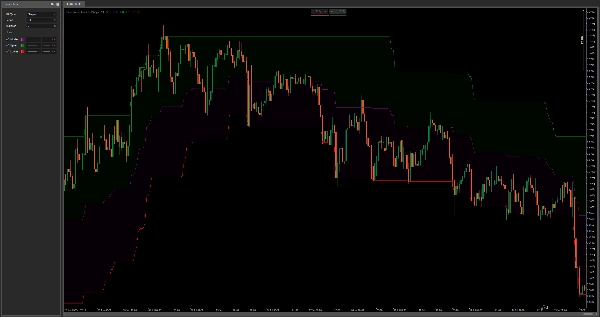
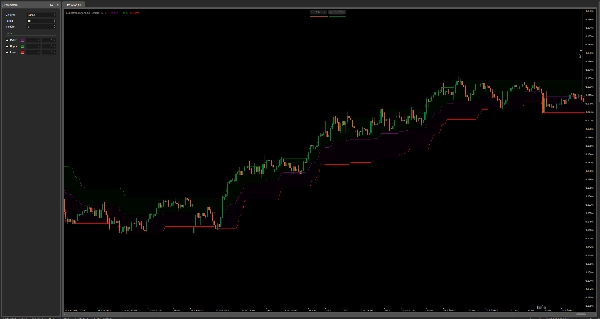
SupertrendChannels
Logo „SupertrendChannels”
24/07/2025
Desktop
Since 03/01/2025
Sprzedaż
3

Supertrend Channels is a custom overlay indicator designed to help traders visually identify dynamic support and resistance zones, entry signals, and trailing stop-loss levels using ATR-based logic.

The indicator plots three lines:

  • Upper Band (Green) – acts as a dynamic resistance or trailing stop-loss for long trades.
  • Lower Band (Red) – acts as dynamic support or trailing stop-loss for short trades.
  • Middle Line (Purple) – serves as a mean-reversion level or potential entry point.

It calculates bands using the Average True Range (ATR) multiplied by a user-defined factor (Multiplier) and adds/subtracts that from the high/low of the current candle. A smoothing method (selectable MA type) is applied to the ATR to adjust responsiveness.

How to Use:

  • Entry: Look for entries near the middle line during consolidations or after crossing signals.
  • Trailing Stop-Loss: Use upper/lower bands as dynamic exit zones to lock in profit as trends extend.
  • Support & Resistance: These bands act like adaptive zones that reflect recent volatility and help spot potential turning points.

Unlike standard Bollinger Bands, this approach anchors bands off price extremes plus volatility, not a moving average, making it more responsive in trending environments and more adaptable for discretionary or algorithmic trading.

Więcej od tego autora
SwingHighLow
Auto-detect swing highs/lows. Spot reversals, map structure, and filter noise with adjustable strength.
Fisher_m11
Fisher Transform with smoothing. Spot reversals and cycles with precision. Great for any market, any timeframe.
LaguerreRSI
Laguerre RSI: smoother, faster RSI with less noise. Great for spotting reversals and timing entries.
HTFBB
Plot higher-timeframe Bollinger Bands for clearer structure, pullback zones, and breakout signals—without switching char
SupertrendHTF
Overlay higher-timeframe SuperTrend to filter noise, follow real trends, and avoid lower-timeframe whipsaws. As
VixFix
A volatility spike detector based on Larry Williams’ VIX Fix. Highlights market fear moments with clear histogram signal
TrendMagicOptimized
Clean trend indicator using CCI & ATR. Highlights up/down trends with adaptive, no-repaint lines.
IBSBot
Buy-only IBS bot for indices on Daily timeframe. Enters near lows, exits near highs. No noise, just clean reversion.
Możesz także polubić
Wskaźnik
Indices
XAUUSD
Commodities
+5
cAlgoBuddy - Chaos Reversals
The cTrader Chaos Reversals indicator brings high-quality reversal signals to traders.
50 percent
This indicater is a magical impact which shows exactly high and low with 100% results
IVB 2.0
IVB 2.0 is an indicator that works on the strategy of imbalance of the maximum volatility box of indices
Wskaźnik
RSI
XAUUSD
Breakout
+4
Multi-Level Candle Bias Tracker
Price direction by calculating the probability of reaching new highs/lows. Shows levels & stats📈
Block Order Rreversal
Order BlockIndicator reversal
Wskaźnik
Indices
RSI
Signal
Rsi + Volume
This indicator combines RSI (Relative Strength Index) with volume analysis to generate more reliable trading signals.
Stochastic RSI Indicator
Wskaźnik
NAS100
NZDUSD
Breakout
+12
Supertrend - Multi-Timeframe
Supertrend - Multi-Timeframe Indicator
Golden Boom And Crash Spike Detector
Golden Boom and Crash Spike Detector is a trading tool designed for Crash 300 and Boom 300 indices on M1 Timeframe.
Free Volume Profile v2.0
TraderMaxBBflterXDemo-
TraderMax BB Filter X (DEMO) for cTrader 🧪 Limited-Time Demo Version (24h) TraderMax BB Filter X (DEMO) is a precision
Side Volume Profile
Right-anchored cTrader Volume Profile with VAH/VAL/POC, LVZ, top volume+EMA, themes, and fast, readable visuals.
Binary Options Signals Pro
Binary Options Signals Pro – Precision Trading at Your Fingertips
Wskaźnik
RSI
XAUUSD
Breakout
+4
SmartTrend Support & Resistance Lines
🚀 Auto-detects support/resistance & trend channels! Saves time ⏳, spots key levels 🔍
Fury Team E_M_A_su_TF
EMA ON TF (MULTI-TIMEFRAME)
Wskaźnik
Signal
dark-cloud
The Dark Cloud Cover indicator detects a bearish reversal pattern, marking key candles and confirming signals based on v
Wskaźnik
Forex
EURUSD
USDJPY
4 Currencies V2_NSC
Relative Currency Strength 4 Currencies: AUD USD EUR JPY
Zero Lag Exponential Moving Average
ZLEMA (Zero Lag EMA) is a faster, smoother version of EMA, ideal for capturing quick market shifts and trends.