
Dem
Indikator
2 pembelian
Versi 2.0, Apr 2026
Windows, Mac
4.2
Ulasan: 4

Deskripsi
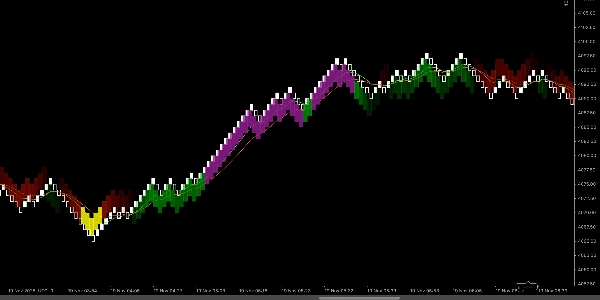
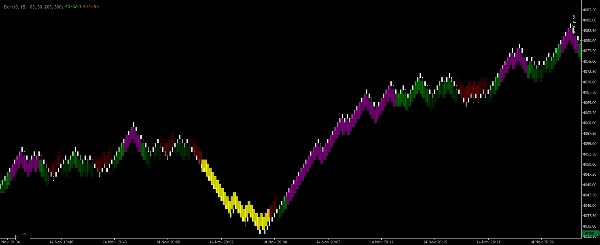
Zona Renko EMA-Scalper adalah indikator scalper visual ringan yang dibuat khusus untuk grafik Renko 100-pip di platform cTrader. Ini menggunakan dua Exponential Moving Averages (EMA) untuk mengidentifikasi arah tren jangka pendek dan menyoroti zona yang bersih dan dapat diperdagangkan. Indikator menggambar persegi panjang berisi di grafik dalam empat warna sehingga scalper dapat segera membaca bias pasar dan menemukan entri dengan probabilitas lebih tinggi tanpa perhitungan manual.
Apa arti setiap warna
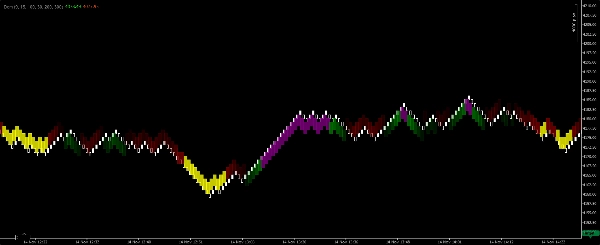
- Persegi panjang hijau — Tren bullish dikonfirmasi. EMA cepat berada di atas EMA lambat dan EMA mengarah ke atas. Gunakan untuk posisi long jangka pendek mengikuti tren.
- Persegi panjang ungu — Zona entri beli dalam konteks bullish. Menunjukkan pullback jangka pendek atau konsolidasi dalam tren bullish aktif yang mungkin menawarkan peluang scalping.
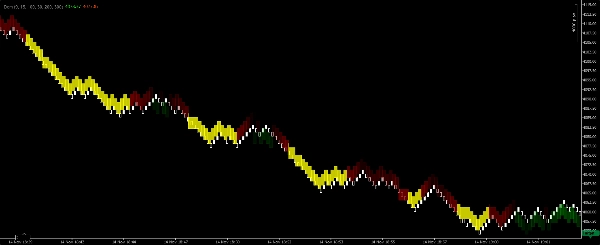
- Persegi panjang merah — Tren bearish dikonfirmasi. EMA cepat berada di bawah EMA lambat dan EMA mengarah ke bawah. Gunakan untuk posisi short jangka pendek mengikuti tren.
- Persegi panjang kuning — Zona entri jual dalam konteks bearish. Menunjukkan pullback jangka pendek atau konsolidasi dalam tren bearish aktif yang mungkin menawarkan peluang scalping.
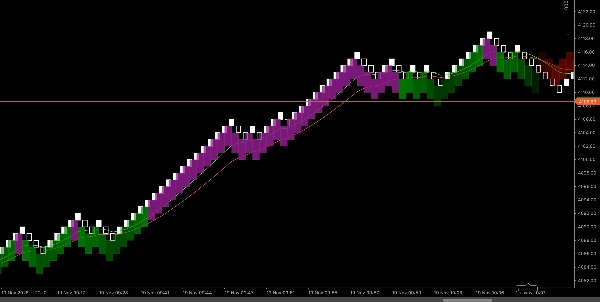
Cara kerjanya (ringkasan logika)
- Indikator menghitung dua EMA (Cepat dan Lambat) pada grafik Renko 100-pip dan menilai keselarasan relatif serta kemiringannya untuk menentukan arah tren.
- Ketika EMA menunjukkan keselarasan bullish yang jelas dan momentum, indikator menggambar Persegi panjang Hijau yang mencakup wilayah tren. Jika terjadi konsolidasi singkat atau pullback dalam wilayah bullish tersebut, indikator menggambar Persegi panjang Ungu untuk menandai peluang entri beli.
- Logika yang sama berlaku secara terbalik untuk kondisi bearish, menghasilkan Persegi panjang Merah (tren) dan Persegi panjang Kuning (entri).
- Persegi panjang digambar sebagai zona (bukan bar tunggal) sehingga scalper dapat menilai secara visual kapan waktu yang tepat untuk entri dan keluar cepat.
Pengaturan yang disarankan (default scalper)
- Jenis grafik: Renko
- Ukuran batu bata Renko: 100 pips (indikator dirancang untuk ukuran batu bata ini).
- Sensitivitas / deteksi — parameter yang dapat disesuaikan mengontrol seberapa ketat indikator membutuhkan keselarasan EMA sebelum menggambar persegi panjang tren (lebih rendah = lebih banyak sinyal; lebih tinggi = lebih sedikit sinyal yang lebih kuat).
- Opasitas persegi panjang — sesuaikan untuk kejelasan visual di atas bar harga.
- Filter sesi — disarankan membatasi pada jam likuiditas tinggi untuk scalping.
- Lebar zona maksimum (bar) — batas opsional untuk menghindari zona yang terlalu lebar.
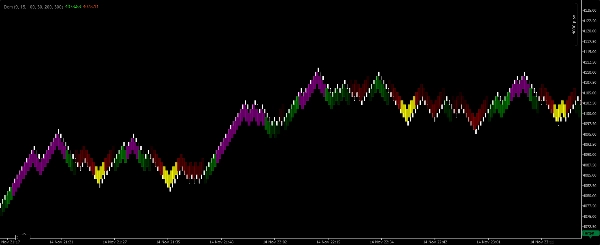
Panduan penggunaan & aturan scalper
- Perlakukan Persegi panjang Hijau/Merah sebagai konfirmasi tren. Lebih baik berdagang sesuai arah zona tren berwarna dan hindari scalping melawan tren yang agresif saat persegi panjang tren mendominasi.
- Gunakan Persegi panjang Ungu/Kuning sebagai jendela entri scalping dalam tren yang sudah dikonfirmasi — cari pemicu mikro-struktur cepat (misalnya, bar momentum, breakout dari konsolidasi kecil) sebelum masuk posisi.
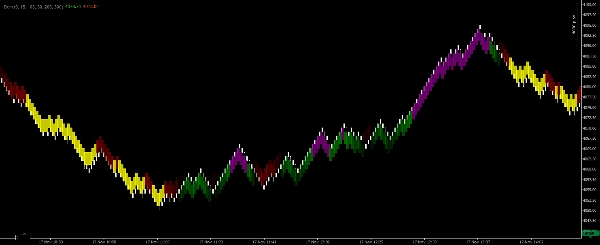
- Target harus ketat dan realistis untuk scalping (kelipatan kecil dari stop Anda). Gunakan target pip tetap atau konfirmasi bar minimum tergantung profil risiko Anda.
- Tempatkan stop di luar level mikro-struktur rendah/tinggi terbaru atau di luar zona entri; scalping membutuhkan disiplin dan kerugian kecil.
- Gabungkan dengan konfirmasi volume/aksi harga (jika tersedia) dan berdagang hanya selama sesi aktif.
- Uji coba secara visual pada instrumen Anda — Renko 100-pip cocok untuk pasangan dan instrumen volatil di mana batu bata 100-pip menghasilkan struktur harga yang berguna untuk scalping.
Ringkasan
Profil indikator
Ulasan pelanggan
4.2
Ulasan: 4
5 | 50 % | |
4 | 25 % | |
3 | 25 % | |
2 | 0 % | |
1 | 0 % |
Ulasan pelanggan
November 25, 2025
A decent setup here should survive 50 quick trades without looking messy. A few sessions of data make the result easier to trust. The useful comparison is hit rate versus average R.
November 18, 2025
The product feels more useful when the plan is already written down. A 13 setup run on daily close keeps the review grounded.
November 18, 2025
This feels useful when you already has a plan. The main value is short term execution, not chasing every signal that appears. Early sizing should stay modest until the journal looks stable.
November 18, 2025
Useful tool, but not for lazy entries. It supports short term execution and feels more useful if the trader stays selective.
Diskusi
Pertanyaan umum
BTCUSD
Forex
Signal
Scalping
Commodities
Crypto
XAUUSD
Produk-produk yang tersedia melalui cTrader Store, termasuk bot trading, indikator, dan plugin, disediakan oleh pengembang pihak ketiga serta hanya ditujukan untuk akses teknis dan informasi. cTrader Store bukan broker dan tidak menyediakan saran investasi, rekomendasi pribadi, atau jaminan apa pun tentang kinerja di masa mendatang.
Produk lain dari penulis ini


Harga
Sejak 14/03/2025
23
Penjualan