
Opis
⚡ Filtr Trendu ADXVMA Aurora łączy siłę trendu ADX z adaptacyjną mieszanką EMA, tworząc niezawodną bazę handlową. W przeciwieństwie do zwykłych wskaźników z ustalonym wygładzaniem, Aurora dostosowuje się w czasie rzeczywistym—bliżej ceny w silnych trendach, bardziej wygładzona w zakresach—i wyświetla czysty trend Wzrostu / Spadku / Neutralny z opcjonalnymi strzałkami przecięcia. Efektem jest większa responsywność niż statyczne MA oraz większa stabilność niż sam ADX.
🆚 Dlaczego jest silniejszy niż zwykłe wskaźniki
- W porównaniu do stałych MA: współczynnik adaptacyjny zmniejsza opóźnienie w trendach i filtruje szumy w zakresach.
- W porównaniu do surowego ADX: przekształca siłę w bazę handlową (z kolorami i sygnałami przecięcia), a nie tylko liczbę.
- W porównaniu do ogólnych filtrów: szybka/wolna EMA ważona ADX zapewnia zrównoważoną mieszankę czułości i stabilności.
🧠 Silnik: mieszanka EMA ważona ADX
ADX (0…100) mierzy siłę trendu. Aurora miesza szybką i wolną EMA, używając ADX jako wagi:
- Wysoki ADX → skłonność do szybkiej (mniejsze opóźnienie).
- Niski ADX → skłonność do wolnej (lepsze filtrowanie szumów).
Linia jest kodowana kolorami według nachylenia (i może być ustawiona na Neutralną, gdy ADX jest słaby), dając czysty odczyt Niebieski / Czerwony / Żółty.
🔭 Co robi
- Adaptacyjna baza: miesza szybką i wolną EMA, używając ADX jako wagi.
- Kolory w trzech stanach: Niebieski (Wzrost), Czerwony (Spadek), Żółty (Neutralny).
- Kolorowe świece: kolorowanie świec dla natychmiastowego kontekstu.
- Strzałki przecięcia: tryby Według Trendu (Klasyczny) lub Wszystkie Przecięcia (Prosty).
- Panel kontrolny: bieżące okresy, ADX i stan trendu.
- Gotowy do bota: ukryte serie TrendState (−1/0/+1) i ADX dla cBots/skanerów.
🎯 Jak handlować
- Nastawienie: powyżej linii + niebieski → skup się na pozycjach długich; poniżej linii + czerwony → skup się na pozycjach krótkich; żółty → odstaw się na bok.
- Wejście: weź strzałkę przy przebiciu ceny przez linię bazową (wybierz Według Trendu lub Wszystkie Przecięcia).
- Wyjście: zatrzymaj się na linii Aurora ± bufor; zysk realizuj przy RR≥2 lub przy przeciwnym przecięciu/zmianie koloru.
🚀 Presety (szybki start)
- Scalp: VMA=12 · ADX=14 · ADX-Thr=28 · NeutralSlope=0.04 · Link=VMA→2×VMA
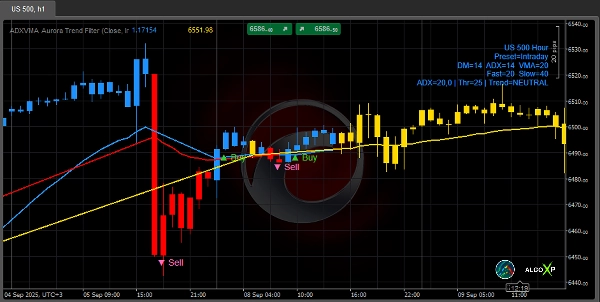
- Intraday: VMA=20 · ADX=14 · ADX-Thr=25 · NeutralSlope=0.06 · Link=VMA→2×VMA
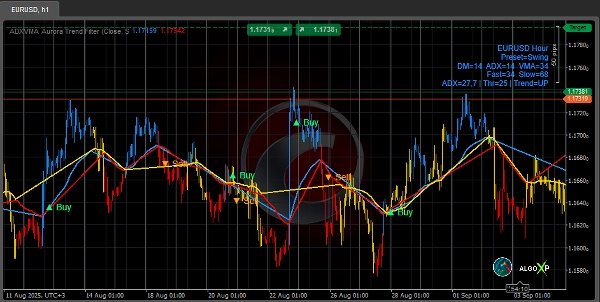
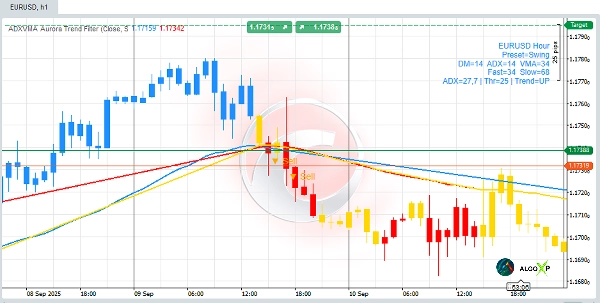
- Swing: VMA=34 · ADX=14 · ADX-Thr=23 · NeutralSlope=0.10 · Link=VMA→2×VMA
- Pozycja: VMA=55 · ADX=14 · ADX-Thr=20 · NeutralSlope=0.15 · Link=VMA→2×VMA
🔧 Kluczowe parametry
- Okresy DM / ADX / VMA (oddzielne, w stylu Wildera).
- Używaj oryginalnego DM (Wilder): ścisłe +DM/−DM (zalecane Włączone).
- Adaptacyjny link: Link do VMA (Szybki=VMA, Wolny≈2×VMA) lub Ręczny Szybki/Wolny.
- Neutralne nachylenie (pipsy): czułość nachylenia na świecę.
- Płasko jeśli ADX < próg: wymuszaj Neutralny podczas słabego trendu (Włącz/Wyłącz).
- Strzałki / Kolorowe świece / Panel: włącz/wyłącz; Tryb strzałek: Według Trendu / Wszystkie Przecięcia.
🎯 Idealny dla:
- Skalperów, traderów intraday i swing szukających jasnego filtra trendu + prostych sygnałów
- Traderów algorytmicznych potrzebujących stabilnych, czytelnych dla maszyn serii.
🧭 Ramy czasowe i wskazówki rynkowe
- Niższe TF (M1–M5): więcej szumów → zacznij od VMA 10–14, NeutralSlope 0.04–0.08, ADX Thr 25–30.
- Intraday (M15–H1): VMA 18–24, NeutralSlope 0.06–0.12, ADX Thr 22–28.
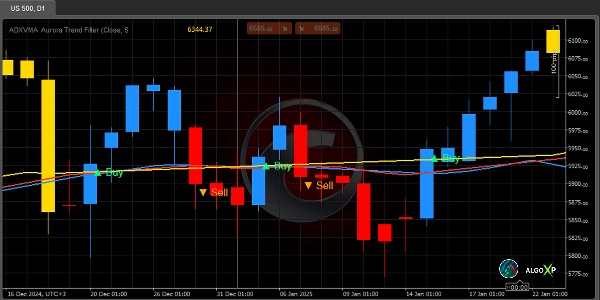
- Wyższe TF (H4–D1): VMA 30–60, NeutralSlope 0.10–0.25, ADX Thr 20–25.
- Główne vs. zmienne (XAU, Crypto): zwiększ VMA / NeutralSlope / Próg o jeden stopień dla rynków zmiennych.
Podsumowanie
The core mechanism uses ADX (0–100) to weight a fast and slow EMA: high ADX values favor the fast EMA for responsiveness, while low ADX values favor the slow EMA for stability. This approach delivers more responsiveness than static moving averages and greater stability than ADX alone.
Key features include candle color bars for instant trend context, a dashboard showing live periods and trend states, and hidden series outputs (TrendState and ADX) suitable for algorithmic trading and scanners. It supports multiple preset configurations for scalping, intraday, swing, and position trading, with adjustable parameters for trend detection sensitivity and noise filtering.
The indicator is applicable across various markets including Forex, indices, commodities, stocks, and cryptocurrencies, and is designed for use on multiple timeframes from one minute to daily charts. It is suitable for traders seeking a clear trend filter with simple triggers and for algo traders requiring stable, machine-readable signals.
Opinie klientów
5 | 33 % | |
4 | 67 % | |
3 | 0 % | |
2 | 0 % | |
1 | 0 % |


