
Opis
Wskaźnik Przełamania Zmienności - Silnik Zmienności Hawkes
Ten wskaźnik ma na celu dostarczenie kontekstu, a nie natychmiastowych działań handlowych. Składnik zmienności pomaga zrozumieć, kiedy warunki rynkowe się zmieniają - okresy niskiej zmienności często poprzedzają duże ruchy, a okresy wysokiej zmienności ostatecznie się wyczerpują. Składnik EWMA utrzymuje orientację w rozwijającym się trendzie i podkreśla, kiedy cena oddala się od niego.
Połącz te dwie perspektywy - reżim zmienności i kontekst trendu - z własną metodologią handlu i osądem. Wskaźnik pokazuje Ci środowisko - Ty decydujesz, co w nim zrobić.
Wersja 2.0
Otwarte na przyszłe aktualizacje
-----------------------------------------------------------------------------------------------------------------------------------------------------------------------
Przegląd
-----------------------------------------------------------------------------------------------------------------------------------------------------------------------
Ten wskaźnik łączy dwa odrębne składniki, aby pomóc traderom jednocześnie identyfikować reżimy zmienności i warunki trendu.
Pierwszy składnik wykorzystuje Proces Hawkes do wykrywania zmian w zmienności rynku. W przeciwieństwie do tradycyjnych wskaźników zmienności, nie przewiduje kierunku — sygnalizuje jedynie, kiedy rynek przechodzi z cichej kompresji do aktywnej zmienności lub odwrotnie. Można go traktować jako detektor stanu zmienności: informuje, kiedy sytuacja się rozgrzewa lub ochładza, ale nie wskazuje, w którą stronę pójdzie cena.
Drugi składnik dodaje podwójny system EWMA (wykładnicza średnia krocząca ważona), który nakłada się na wykres cenowy. Daje to kontekst trendu za pomocą przecięcia szybkiej i wolnej średniej kroczącej, z dodatkową warstwą kolorowania świec, pokazującą, kiedy cena odchodzi od trendu.
-----------------------------------------------------------------------------------------------------------------------------------------------------------------------
Jak to działa
-----------------------------------------------------------------------------------------------------------------------------------------------------------------------
Wykrywanie zmienności: Wskaźnik wykorzystuje estymator zmienności Parkinsona High-Low — metodę bardziej efektywną niż standardowy ATR, ponieważ używa pełnego zakresu świecy. Ta znormalizowana zmienność jest przetwarzana przez obliczenia Procesu Hawkes, które następnie porównywane są z dynamicznymi progami opartymi na kwantylach.
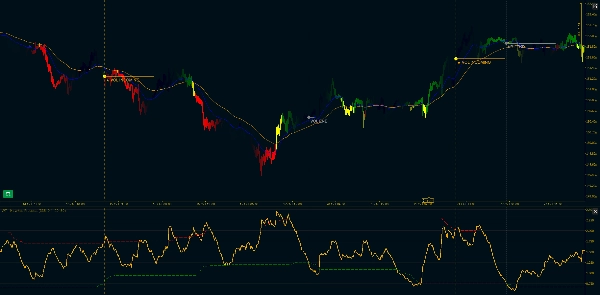
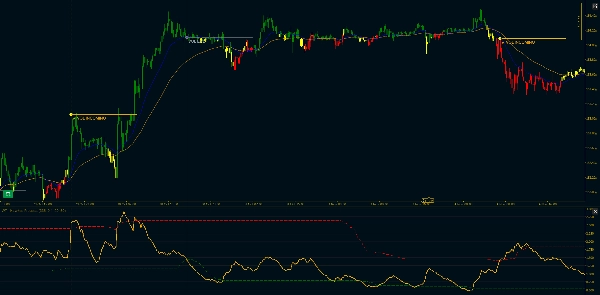
Gdy zmienność przebija górny próg po okresie kompresji, otrzymujesz sygnał "VOL INCOMING". Gdy spada poniżej dolnego progu, pojawia się "VOL END". To nie są sygnały wejścia — to zmiany reżimu zmienności. Rynek albo się budzi, albo zasypia.
Kontekst trendu: Na głównym wykresie pojawiają się dwie wykładnicze średnie kroczące (Szybka i Wolna). Szybka MA jest niebieska, Wolna MA pomarańczowa. Gdy Szybka jest powyżej Wolnej, trend jest wzrostowy. Gdy Szybka jest poniżej Wolnej, trend jest spadkowy.
Filtr dywergencji: Tutaj robi się ciekawie. Czasami cena znacznie oddala się od trendu. Gdy cała świeca (otwarcie, maksimum, minimum, zamknięcie) znajduje się poniżej Szybkiej MA podczas trendu wzrostowego lub powyżej niej podczas trendu spadkowego, słupek zmienia kolor na żółty. To ścisły filtr — jeśli nawet knot dotyka Szybkiej MA, pozostaje normalny kolor trendu.
Żółte słupki często pojawiają się przy korektach lub punktach wyczerpania, ale pamiętaj: nie mówią, co będzie dalej, tylko że cena tymczasowo oddzieliła się od linii trendu.
-----------------------------------------------------------------------------------------------------------------------------------------------------------------------
Kluczowe cechy
-----------------------------------------------------------------------------------------------------------------------------------------------------------------------
Składnik zmienności:
- Normalizacja zmienności Parkinson High-Low (bardziej efektywna niż standardowa metoda ATR)
- Obliczenia Procesu Hawkes z regulowanym zanikiem (parametr Kappa)
- Dynamiczne progi oparte na kwantylach (konfigurowalne percentyle)
- Wizualne oznaczenia: "VOL INCOMING" przy wybiciach zmienności, "VOL END" przy kompresjach
- Filtrowanie kontynuacji: oznaczane jest tylko pierwsze wybicie, nie każdy skok
- Opcjonalne poziome linie trendu i pionowe znaczniki
Składnik trendu EWMA:
- Obliczenia EWMA kompatybilne z Pandas (formuła adjust=True)
- Linie szybkiej i wolnej MA wyświetlane na głównym wykresie cenowym
- Konfigurowalne długości okresów (domyślnie: 20/50)
- Wsparcie minimalnych okresów (tłumi wyjście do momentu zebrania wystarczających danych)
- Opcja ignorowania NA do obsługi luk
- System świec w trzech kolorach: Zielony (trend wzrostowy), Czerwony (trend spadkowy), Żółty (dywergencja)
Opcje personalizacji:
- Okres Parkinsona (okres wstecz do obliczeń zmienności)
- Kappa Hawkes (szybkość zaniku, wpływa na czułość)
- Okres wstecz do kwantyli
- Progi niskiej i wysokiej zmienności (percentyle)
- Przełącznik annualizacji i długość segmentu
- Okresy szybkiej i wolnej średniej kroczącej
- Kolory byczy, niedźwiedzi i dywergencji
- Długość rozszerzenia linii trendu
- Pokaż/ukryj pionowe znaczniki
----------------------------------------------------------------------------------------------------------------------------------------------------------------------------
Notatka techniczna: Składnik Procesu Hawkes wykorzystuje rekurencyjne obliczenia wykładnicze zoptymalizowane do użytku w czasie rzeczywistym. Implementacja EWMA odpowiada zachowaniu Pandas dla spójności z testowaniem wstecznym opartym na Pythonie. Oba składniki obliczają wartości tylko na zamkniętych świecach, aby uniknąć przerysowywania.
Podsumowanie
Opinie klientów
5 | 100 % | |
4 | 0 % | |
3 | 0 % | |
2 | 0 % | |
1 | 0 % |


