
Описание
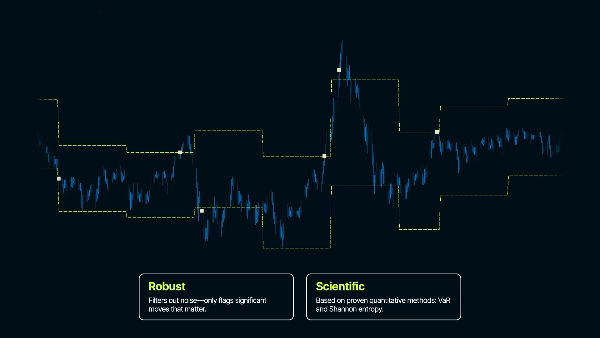
Индикатор выхода и повторного входа при скачках цены (PjER) является индикатором управления рисками, основанным на научной статье «Динамическая стратегия выхода и повторного входа при скачках цены для внутридневной торговли» авторства Кёгеленберга и ван Вурена (2024), опубликованной в журнале Expert Systems With Applications.
Ключевое новшество
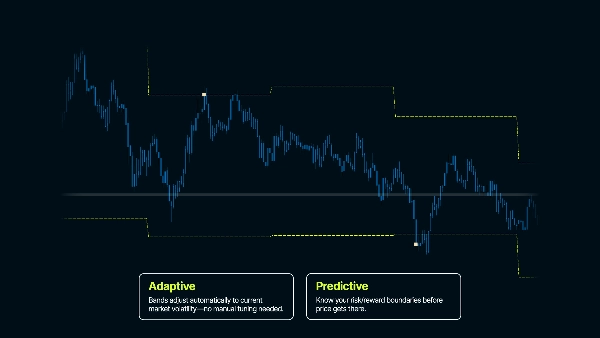
- Оценки VaR потенциальных убытков до их возникновения
- Устойчивость к сильным рыночным трендам на коротких временных интервалах
- Анализ коррекции рынка после скачка для безопасного времени повторного входа
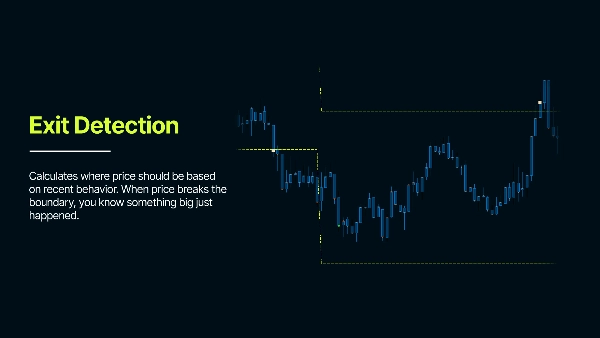
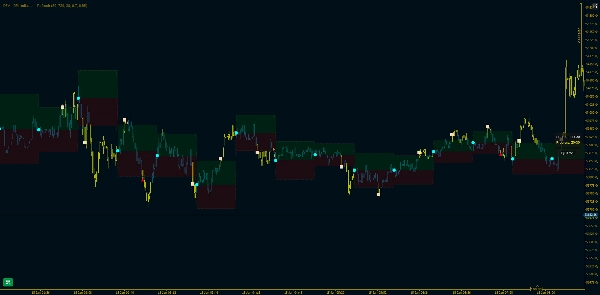
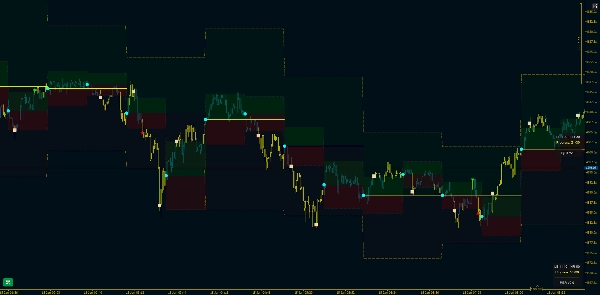
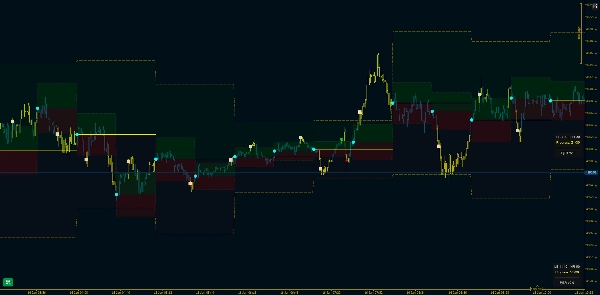
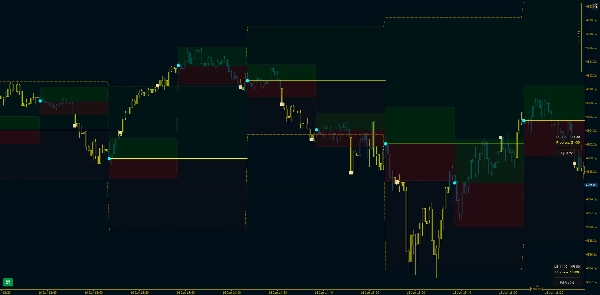
Он анализирует прошлые движения цены для понимания типичной волатильности и создает доверительные интервалы - представляющие ожидаемый диапазон цены. Когда цена выходит за эти границы, это сигнализирует о том, что произошло что-то аномальное.
Целевое применение
Внутридневная торговля (особенно стратегии, основанные на диапазонах). Этот индикатор создает статистические границы вокруг цены для обнаружения аномальных движений цены. При нормальном поведении рынка цена остается в пределах ожидаемых диапазонов, основанных на недавней волатильности. Когда цена пробивает эти границы, это сигнализирует о том, что происходит что-то необычное — потенциальная точка выхода из сделки или прорыв в структуре рынка, поскольку поведение рынка изменилось.
Объяснение основных параметров
Максимальное количество дней назад - Определяет, насколько далеко назад в истории индикатор начинает работать
Смещение GMT - Корректирует ваш часовой пояс. Обеспечивает совпадение расчетов даты с вашим местным временем
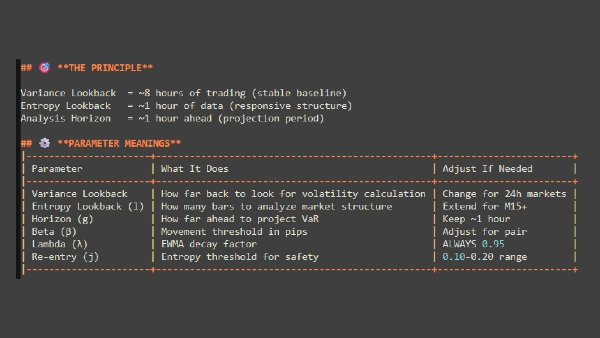
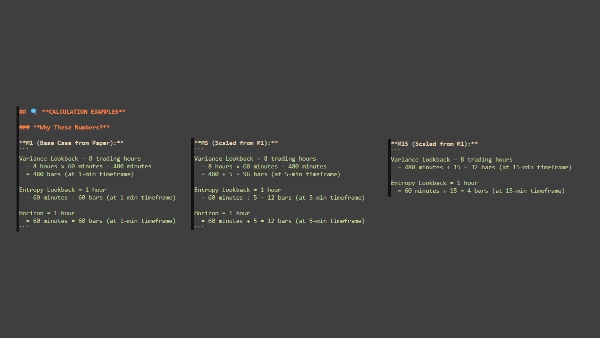
Период обратного просмотра (бары)
"Сколько истории цены следует использовать для измерения 'нормального' поведения?"
- Сколько баров исторических данных использовать для расчета волатильности
- Больше баров = стабильнее, но медленнее адаптация; меньше баров = быстрее реакция, но больше шума
- Пример: 1440 баров на M1 = 24 часа данных
Горизонт анализа (бары)
"Как долго следует наблюдать цену перед началом нового анализа?"
- Как долго длится каждый период анализа перед сбросом границ
- Определяет временной интервал анализа - короче = более частые сбросы, длиннее = границы остаются фиксированными дольше
- Пример: 60 баров = границы сохраняются 60 баров, затем пересчитываются от новой эталонной цены
Вероятность риска
"Насколько я хочу быть уверен, что цена обычно не достигнет этих уровней?"
- Устанавливает уровень доверия для границ (как запас безопасности)
- Более высокие значения = шире границы (меньше сигналов), более низкие значения = уже границы (больше сигналов)
- Пример: 0.80 = 80% уверенности, что цена останется в пределах границ при нормальных условиях
Коэффициент затухания (λ - Лямбда)
"Стоит ли уделять больше внимания тому, что только что произошло, или относиться ко всей истории одинаково?"
- Контролирует, насколько важны недавние данные по сравнению со старыми в расчетах волатильности
- Более высокие значения = недавние данные важнее; более низкие значения = все данные взвешены более равномерно
- Пример 0.95 = недавняя волатильность сильно влияет на расчет
ВАЖНЫЕ МОМЕНТЫ ДЛЯ ЗАПОМИНАНИЯ
Это инструмент УПРАВЛЕНИЯ РИСКАМИ – Выявляет события волатильности и стабильность за периоды времени
Доверительные интервалы критичны – Границы НЕ должны следовать за ценой как ATR – Границы рассчитываются для каждого периода анализа
Повторный вход требует терпения – Не ожидайте мгновенного повторного входа после выхода – рынку нужно время для стабилизации
Параметры специфичны для актива и временного интервала – Параметры по умолчанию являются отправной точкой – Оптимизируйте под ваш конкретный рынок и стиль – То, что работает на FX, может не работать для Индексов, Металлов или Криптовалют.
( * ) Этот индикатор предоставляется исключительно в образовательных и информационных целях. Он не предназначен как финансовый или инвестиционный совет. Ничто в этом продукте, его документации или любых связанных материалах не должно рассматриваться как рекомендация покупать, продавать или удерживать какие-либо финансовые инструменты. Торговля на финансовых рынках связана с высоким риском и может не подходить для всех инвесторов. Прошлые результаты не гарантируют будущих. Нет гарантии прибыли, и пользователи могут понести значительные убытки. Используя этот индикатор, вы признаете, что несете полную ответственность за свои торговые решения и финансовые результаты. Создатель этого продукта не несет ответственности за любые убытки или повреждения, возникшие прямо или косвенно в результате его использования. Всегда проводите собственный анализ перед принятием торговых решений.
Сводка
Key features include Value at Risk (VaR) estimates to anticipate potential losses, robustness against strong short-term trends, and analysis of post-jump corrections to identify safe re-entry timings. Core adjustable parameters allow users to tailor the indicator to specific assets and timeframes, including lookback period for volatility calculation, analysis horizon for band recalculation frequency, risk probability to set confidence levels, and decay factor to weight recent versus older data.
The indicator emphasizes patience for re-entry after exits, as market stabilization is required. It is intended as a tool for identifying volatility events and managing risk rather than providing direct trade signals. Users should optimize parameters according to their trading style and market conditions.
Отзывы покупателей
5 | 100 % | |
4 | 0 % | |
3 | 0 % | |
2 | 0 % | |
1 | 0 % |


