
Описание
1. Что такое Hyper Trend и для кого он предназначен
Hyper Trend — это индикатор, следующий за трендом, для cTrader. Он предоставляет одну простую для чтения скользящую линию тренда, зону для присоединения к тренду, четкие сигнальные маркеры, опциональное отображение стоп-лосса / тейк-профита на графике и интерактивную панель, позволяющую настраивать большинство параметров в реальном времени без повторного открытия настроек.
Цель дизайна — предельно простая: использовать проверенные методы торговли и выдавать тренды и сигналы, которые действительно легко читать — при этом сделать всё легким, ненавязчивым и быстрым в настройке.
Подходит для любого трейдера, независимо от опыта.
-
-
- Новички получают четкое понимание направления и риска.
- Опытные трейдеры получают быстрый, настраиваемый оверлей, который не мешает их собственному анализу цены.
-
Он построен так, чтобы быть простым и эффективным на поверхности, при этом основанным на исследованных методах, и легким в настройке и тонкой подгонке.
"Что бы вы ни торговали и каким бы опытным ни были, Hyper Trend должен быть простым для чтения, легким в настройке и тонкой подгонке."
2. Идея, лежащая в основе
Скользящие средние, ATR, Super Trend, сглаживающие фильтры — это хорошо известные, проверенные
методы, и они существуют именно для того, чтобы делать то, что делает Hyper Trend: превращать необработанную цену в читаемый
тренд с полезными сигналами.
Так зачем еще один инструмент? Потому что на практике большинство индикаторов в этой области имеют те же
проблемы:
-
-
- Переформатирование. Большая часть опубликованного — это одна и та же или старая логика, переименованная и
переизданная снова и снова, с малым количеством действительно нового. - Загромождение графика. Многие добавляют столько элементов на график, что чтение самой цены становится почти
невозможным, а их внутренняя логика иногда противоречит реальным
намерениям трейдера. - Угасающая эффективность. Основные концепции звучат хорошо, но в быстро развивающихся
рынках сегодня — особенно на более быстрых таймфреймах — они часто теряют реальное преимущество.
- Переформатирование. Большая часть опубликованного — это одна и та же или старая логика, переименованная и
-
Hyper Trend стремится противостоять всем трем проблемам. Он сохраняет проверенную основу (сглаживание,
волатильные полосы, направление в стиле Super Trend), но применяет новые подходы к предварительной обработке данных, сглаживанию цены и обработке сигналов — такие методы обсуждаются
в научных статьях, торговых журналах и академических исследованиях. Все ссылки на источники можно найти в описании видео.
ССЫЛКИ НА ИСТОЧНИКИ
- ECB: Фильтр тренд-цикла(-сезона)
- Фильтр Калмана: от интуиции к вероятностной графической модели и реальному случаю на финансовых рынках
- Финансовые модели ценообразования в непрерывном времени и фильтрация Калмана
- Фильтр Холта-Уинтерса и односторонний фильтр HP: тесное соответствие
- Байесовская структура для разложения тренда и сезонности
- Доходность хедж-фондов, фильтр Калмана и ошибки в переменных
- Скользящие средние для сглаживания финансовых данных
- Оптимизация производительности стратегии фрактального адаптивного скользящего среднего: случай EUR/USD
- Фильтр Калмана и оптимальное сглаживание, выведенное регрессионной моделью
Цель — проверить простой вопрос на практике: могут ли эти теоретические концепции,
применённые поверх проверенных инструментов, вернуть реальное преимущество трейдеру? Hyper Trend — это
конкретный пример такой попытки — проверенные методы, модернизированные там, где это важно, с
читабельностью как первоклассной функцией, а не после мысли.
"Те же проверенные основы — усреднение, волатильность, логика тренда — но с
современной предварительной обработкой и неустанным вниманием к сохранению читаемости графика."
3. Ключевые моменты — что делает его особенным
Ненавязчивый оверлей по дизайну. Он сохраняет осознанный баланс между отображением действительно полезного поверх цены и не искажением потока цены, которую вы читаете.
Оптимизирован для cTrader — быстрый и легкий. Он разработан для быстрой загрузки и низкого использования ЦП, и рассчитан на плавную работу даже с несколькими запущенными экземплярами одновременно, на нескольких графиках или символах, чтобы ваша платформа оставалась отзывчивой.
Чистый конвейер под капотом.
-
-
- Выберите источник цены. Вы выбираете, по какой цене будет идти расчет — закрытие,
средняя точка, например HL2, типичная цена, например HLC3, и так далее (настройка источника). - Опциональная предварительная обработка. Вы можете пропустить эту цену через свечи Heikin-Ashi
и/или фильтр Калмана перед остальными шагами, чтобы сгладить шумные ряды — это часть
идеи "модернизированной обработки". - Сглаженная основа тренда. Выбранный источник сглаживается, чтобы сформировать основу тренда, на которой строится остальная логика — предназначена для отслеживания доминирующего движения.
- Полосы волатильности. ATR, сглаженный по Уайлдеру, задает полосу выше и ниже этой основы.
- Логика SuperTrend. Стандартная "липкость" SuperTrend решает, какая сторона активна:
при восходящем тренде нижняя полоса становится скользящей линией; при нисходящем — верхняя.
Когда цена закрывается через активную полосу, тренд меняется.
- Выберите источник цены. Вы выбираете, по какой цене будет идти расчет — закрытие,
-
"Он создан, чтобы легко сидеть на графике — показывать то, что помогает, скрывать то, что
не нужно, и никогда не мешать самой цене. Один клик на панели возвращает вас к
чистой цене в любое время."
4. Чтение графика — основные визуальные элементы
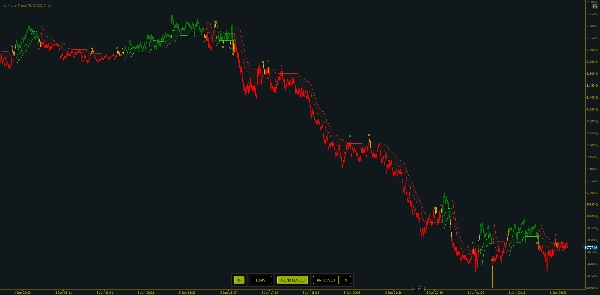
1. Скользящая линия
-
- Зеленая = восходящий тренд (линия под ценой)
- Красная = нисходящий тренд (линия над ценой)
- Изменение цвета — это смена тренда
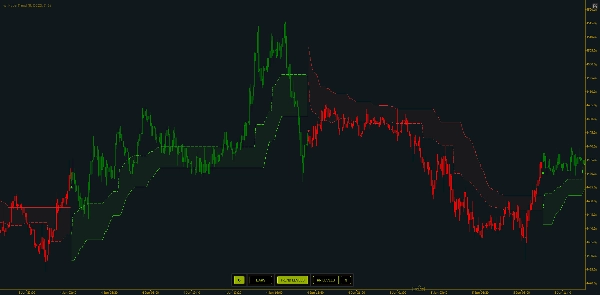
2. Зоны входа
-
- При включении пунктирный уровень располагается на небольшом расстоянии от скользящей линии в сторону противоположной полосы — это "откат к значению" внутри текущего тренда, а не погоня за экстремумом.
Entry Zone Distanceконтролирует, насколько далеко она расположена.
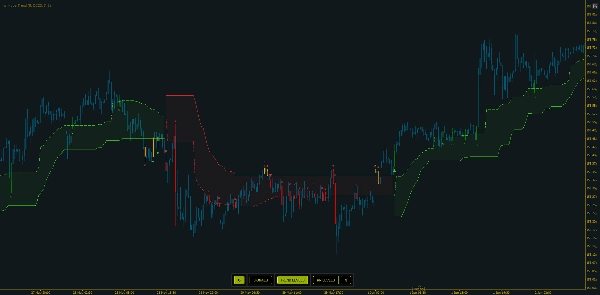
3. Окраска баров
-
- Бары могут окрашиваться в зависимости от активного направления, с тремя стилями:
-
- Обычный (бычий/медвежий по направлению),
- Режим 1, обеспечивает другую визуализацию в переходных фазах
- Режим 2, который дополнительно отмечает нейтральные переходные бары.
Видимая зеленая/красная скользящая линия — это конечный результат. Всё остальное — зоны входа, маркеры, линии SL/TP, окраска баров — накладывается поверх того же состояния направления.
"Цвет линии — ваш взгляд на режим; пунктирная зона — место, где тренд предлагает более разумный вход."
5. Сигналы и оповещения
Hyper Trend различает три типа сигналов. Каждый сигнал выводит маркированный маркер на подтвержденном баре и может быть включен или отключен независимо:
-
- Сигналы переключения (включены по умолчанию) — срабатывают при смене направления тренда (или смещении). Это основной сигнал.
- Сигналы пересечения зоны входа — срабатывают при подтвержденном круговом пересечении зоны входа внутри существующего тренда (цена покидает и возвращается в зону). Для тайминга входов на откате.
- Сигналы пересечения тренда — срабатывают при подтвержденном круговом пересечении самой скользящей линии. В более насыщенном режиме окраски пересечение трендовой линии на переходном/нейтральном баре рассматривается как сигнал выхода, а не нового входа.
- Сигналы выхода — видны при включенном режиме окраски баров - Режим 2, эти сигналы помогают определить, когда тренд теряет силу, за пару баров до сигналов переключения. Полезны для выявления периодов низкой волатильности с уменьшенным участием рынка, которые приводят к флетовому или боковому движению цены.
Оповещения: при включении Hyper Trend воспроизводит выбранный звук и показывает всплывающее окно для каждого обнаруженного сигнала. Оповещения следуют тем же переключателям — оповещают только те типы сигналов, которые вы включили — а кнопка оповещений на панели на графике включает/выключает их в реальном времени. Всплывающее окно краткое: символ и таймфрейм, тип и направление сигнала, текущая цена.
"Начните с сигнала переключения для чистого графика, затем добавляйте сигналы пересечения для более точного тайминга входа. Каждый из них может оповещать звуком и всплывающим окном."
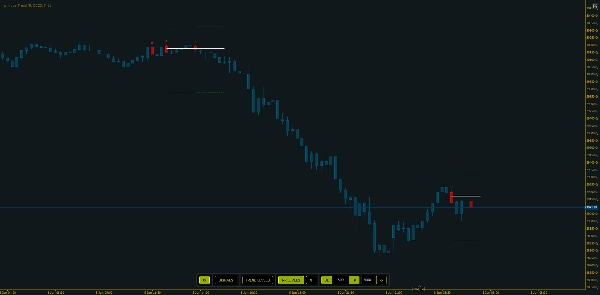
6. Планируйте сделки — уровни риска/вознаграждения на графике
При включенных уровнях стоп-лосса / цели каждый сигнальный бар получает три короткие горизонтальные линии: линия входа на средней цене сигнального бара, линия SL на фиксированном расстоянии в пунктах с убыточной стороны и линия TP на фиксированном расстоянии в пунктах с прибыльной стороны.
Уровни предварительно расширены на фиксированное количество баров и не растут после этого — это снимок на момент сигнала. Новый сигнал усекает предыдущий набор, чтобы уровни не накладывались. Вход, SL и TP имеют свои цвета, с регулируемой шириной и стилями линий.
"Он визуально оформляет сделку — вход, стоп, цель — чтобы вы видели риск и вознаграждение до входа, а затем поддерживает порядок на графике, ограничивая количество активных наборов."
7. Интерактивная панель — изменяйте визуальные настройки в реальном времени
Панель на графике изменяет отображаемое немедленно, без повторного открытия параметров.
Активные переключатели выделены; панель всегда отражает текущее состояние. Вы можете разместить её в нескольких местах на графике или полностью скрыть.
"Всё, что обычно настраивается в параметрах — окраска, уровни тренда, линии риска и расстояния SL/TP — доступно одним кликом на панели. Введите новые расстояния, нажмите обновить, и уровни обновятся."
8. Торговые подходы — несколько примеров
Подход A — Торгуйте по сигналу переключения (следование за трендом). Используйте сигналы переключения как основной ориентир: входите в новом направлении при подтвержденном развороте и используйте скользящую линию как визуальное подтверждение недействительности. Разворот обратно в противоположный цвет — выход/реверс. Самый простой и чистый способ чтения.
Подход B — Вход на откате внутри тренда. При уже установленном тренде ждите, пока цена откатится в зону входа и включите сигналы пересечения входа, чтобы повторное пересечение отметило момент, когда цена возвращается в зону — вход в тренд по более выгодной цене вместо погони за экстремумом.
Подход C — Рамки риска для каждой сделки. Включите уровни RR, установите расстояния SL / TP, соответствующие волатильности символа. Вы видите вход, стоп и цель до входа и управляете сделкой соответственно.
Общая нить во всех трех подходах — суждение: действуйте в направлении тренда, подтверждайте окружающим ценовым действием и используйте линию как ориентир — Hyper Trend — это чтение, вы размещаете и управляете сделкой.
"Торгуйте разворот, или ждите отката в зону, или оформляйте каждую сделку линиями риска — выберите подход, который подходит вашему стилю. Понимайте контекст рынка и сочетайте его с другими инструментами, такими как RSI или MACD, выявляйте дивергенции. Именно это сочетание приносит результат."
9. Как оценить его
Практические проверки: прокрутите историю и посмотрите, удерживала ли линия тренда вас на правильной стороне устойчивых движений и где происходили развороты; сравните два набора настроек рядом (например, разный множитель ATR или период тренда), чтобы увидеть компромисс между отзывчивостью и сглаживанием; проанализируйте исторически рамки SL/TP, чтобы оценить, как часто цель достигалась до стопа на выбранных расстояниях; соотнесите с рынком (явно трендовый или с узким диапазоном); и обратите внимание на время — он выявляет лучшие режимы, когда рынок действительно движется, поэтому сравнивайте активные часы с тихими, внепиковыми периодами.
"Оценивайте, прокручивая историю и сравнивая настройки — насколько чисты развороты, как точно зона входа таймит откаты и как разрешаются рамки SL/TP?"
10. Ограничения и другие заметки
Hyper Trend создан выше качества обычных, переформатированных индикаторов — но это инструмент, а не хрустальный шар:
-
- Он всё еще может выдавать ложные сигналы. Механическое следование каждому сигналу не приведет к положительным результатам самостоятельно.
- Он вознаграждает навык и контекст. Требуется базовая способность читать цену и понимание окружающего рынка. В сочетании с этим контекстом и грамотным управлением капиталом он становится действительно мощным инструментом — и именно такое сочетание обычно дает положительные результаты в долгосрочной перспективе.
- Лучше всего работает, когда рынок движется. Снимки в тихие периоды или полностью вне торговых часов теряют часть качества.
- Инструменты тренда запаздывают и дают ложные сигналы. Как и любой подход в стиле SuperTrend, развороты могут происходить с опозданием и скапливаться в боковиках; сглаживание и полосы ATR уменьшают это, но не устраняют полностью.
- Линии SL/TP — это помощь в планировании, а не гарантия. Фиксированные расстояния в пунктах от средней цены сигнального бара; они не учитывают спред, проскальзывание или фактическое исполнение, и не следуют за ценой.
"Принесите базовое чтение цены, контекст рынка и управление капиталом, и он станет действительно мощным в долгосрочной перспективе — сильнее всего, когда рынок движется."
HyperTrend представлен как чистый, ненавязчивый оверлей с встроенным таймингом входа, четкими сигналами, рамками риска на графике и живой панелью управления. Простой в использовании, легкий для cTrader и предназначенный для любого трейдера, на любом символе или таймфрейме.
"Простой в настройке, легкий в работе и созданный, чтобы помочь любому трейдеру читать тренд, отмечать входы и выходы и оформлять риск — при этом оставаться чистым и читаемым."
Сводка
Under the hood, HyperTrend processes price data through selectable sources and optional smoothing filters such as Heikin-Ashi and Kalman filters. It applies volatility bands based on ATR and SuperTrend logic to determine active trend direction. The indicator offers three types of signals—trend switches, entry zone crosses, and trailing line crosses—with labeled markers and optional alerts via sound and popups.
Risk management is supported through on-chart stop-loss and take-profit levels displayed as horizontal lines at fixed pip distances from entry points, helping traders visualize risk/reward before committing. An interactive on-chart panel allows live adjustment of visual settings and parameters without reopening menus.
HyperTrend is optimized for fast, low-CPU performance on cTrader, suitable for all trader experience levels, and applicable across symbols and timeframes. It emphasizes readability and simplicity while incorporating modern data processing techniques to enhance traditional trend-following methods.


