Описание
🚀 Более 10 000 трейдеров уже используют наши ЛУЧШИЕ индикаторы🏆
Узнайте, почему профессионалы выбирают нас – самые мощные инструменты на cTrader (индикаторы, алгоритмы и cBots) ждут вас.
👉 Получите все наши ЛУЧШИЕ системы здесь:
_______________________________________________
📌 Индикаторы структуры рынка
· ✅ AdvancedMarket Structure: Bos, Choch, SwinLevels, Order Blocks, Market Structure& Liquidity Finder
· 🔄 Динамический анализ структуры рынка поворотных точек
· 🧱 Order Block
· ⚖️ Дисбаланс рынка
· ⛓️ BOS & CHOCH
· 🧠 ICT Power of 3
_______________________________________________
🔚 Системы умного выхода
_______________________________________________
📐 Индикаторы ZigZag
· 🔍 Проекция ликвидности цены ZigZag
· ➖ ZigZag
· 🎯 Трекер экстремумов Zig-Zag
_______________________________________________
🧱 Индикаторы поддержки и сопротивления
· 🟩 SmartTrend линии поддержки и сопротивления
· 🧱 Все уровни поддержки и сопротивления
_______________________________________________
📊 Индикаторы тренда и каналов
· 🔄 Авто-тренд канал
· 📊 Супертренд
· 🌈 Динамический градиент тренда
· 🔁 Реактивная скользящая средняя
_______________________________________________
💧 Инструменты объема и ликвидности
· 📉 Карта ликвидаций с кредитным плечом
· 🔍 Разрыв справедливой стоимости Momentum
· 🕒 Сессии разрыва справедливой стоимости
_______________________________________________
⚡ Индикаторы Momentum и RSI
· 🚀 Динамический диапазон Momentum
· 🔎 Многоуровневый трекер свечного смещения
Tracker
_______________________________________________
🔮 Инструменты прогнозирования и проекции
· 📐 Прогноз на основе линейной регрессии и ATR
· 📏 Фибоначчи линейная регрессия мультивременной
· 📈 Проектор рыночного потока на основе объема
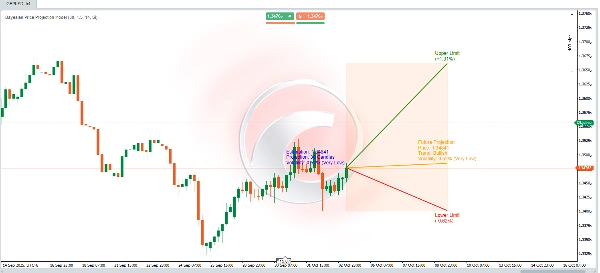
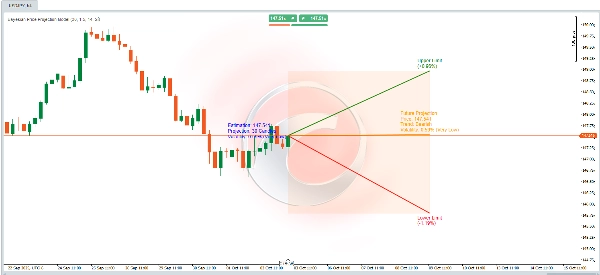
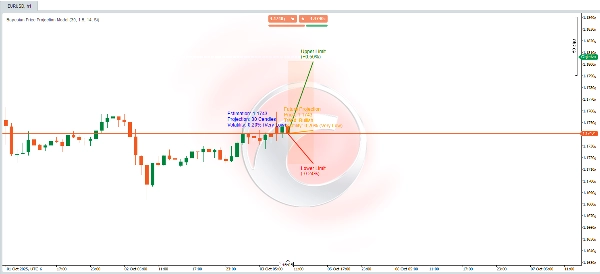
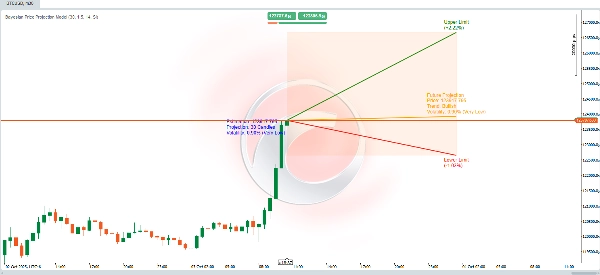
📊 Алгоритм динамической проекции цены 📈
Этот алгоритм сочетает в себе **статистические вычисления**, **технический анализ** и **байесовскую теорию** для прогнозирования будущей цены с предоставлением **диапазонов неопределенности**, представляющих верхние и нижние границы. Вычисления разработаны для корректировки проекций с учетом рыночных **трендов**, **волатильности** и исторических вероятностей достижения новых максимумов или минимумов.
Вот как это работает:
🚀 Проекция будущей цены
Динамический расчет оценивает будущую цену на основе трех ключевых элементов:
1. **Тренд**: Определяет, склонен ли рынок двигаться вверх или вниз.
2. **Волатильность**: Количественно оценивает величину ожидаемого изменения на основе исторических колебаний.
🧠 **Байесовская вероятностная корректировка**
- Условные вероятности рассчитываются с использованием **формулы Байеса**:
\[
P(A|B) = \frac{P(B|A) \cdot P(A)}{P(B)}
\]
Это моделирует будущие события с использованием условной информации:
- **Вероятность достижения нового исторического максимума**, если цена движется вверх.
- **Вероятность достижения нового исторического минимума**, если цена движется вниз.
- Эти вероятности уточняют оценку будущей цены, учитывая:
- **Повышенная волатильность** увеличивает вероятность достижения экстремальных уровней (максимумов/минимумов).
- **Рыночные тренды** влияют на ожидаемое направление движения цены.
🌟 **Расчет волатильности**
- Волатильность измеряется с помощью индикатора **ATR (Average True Range)** с окном в 14 периодов. Это отражает среднюю амплитуду колебаний цены.
- Для выражения волатильности в процентах ATR нормализуется путем деления на цену закрытия и умножения на 200.
- Затем волатильность классифицируется по описательным уровням (например, **Очень низкая**, **Низкая**, **Умеренная** и т.д.) для лучшей интерпретации.
---
🎯 **Пределы отклонения (верхний и нижний)**
- Верхний и нижний пределы формируют **проецируемый диапазон** вокруг оценочной будущей цены, обеспечивая рамки для неопределенности.
- Эти пределы рассчитываются путем корректировки ATR с использованием:
- Пользовательского **множителя** (`factor_desviacion`).
- **Байесовских вероятностей**, рассчитанных ранее.
- **Квадратного корня из проецируемого периода** (`proyeccion_dias`), учитывая принцип, что неопределенность растет со временем.
🔍 **Интерпретация модели**
Это можно рассматривать как **динамическую вероятностную модель**, которая:
- Объединяет **технический анализ** (тренды и ATR).
- Уточняет вероятности с помощью **байесовской теории**.
- Предоставляет **визуальный диапазон проекции**, чтобы помочь понять потенциальные будущие движения цены и связанные с ними неопределенности.
⚡ Независимо от того, анализируете ли вы **волатильные рынки** или подтверждаете **бычьи/медвежьи сценарии**, этот инструмент предоставляет вам надежный, основанный на данных подход! 🚀