Описание
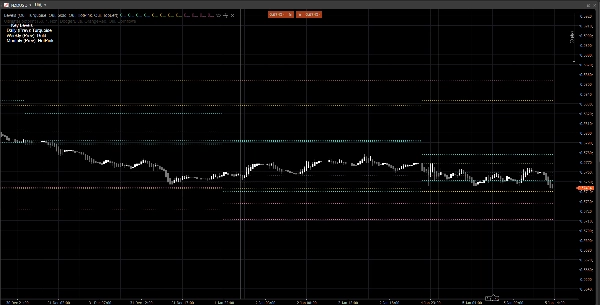
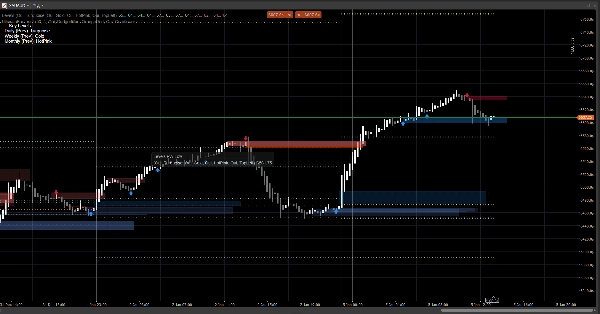
Price Action Zones — это легкий, безшумный индикатор, который отображает предыдущие дневные, недельные и месячные ключевые уровни прямо на вашем графике.
Он отображает:
- Предыдущий день: максимум / минимум / открытие / закрытие
- Предыдущая неделя: максимум / минимум / открытие / закрытие
- Предыдущий месяц: максимум / минимум / открытие / закрытие
Эти уровни широко используются как зоны реакции, ссылки на ликвидность и якоря контекста для структуры рынка, входов, целей и размещения риска.
Почему это полезно
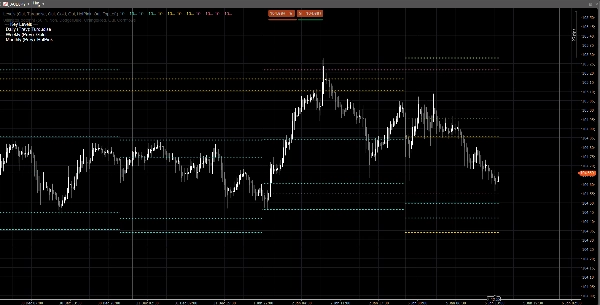
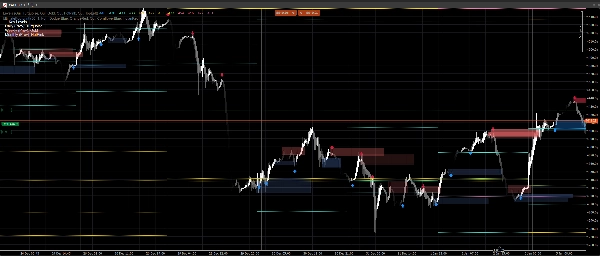
- Мгновенно видеть уровни ссылок более высокого таймфрейма без переключения графиков
- Помогает структурировать внутридневное движение цены вокруг PDH/PDL, PWH/PWL, PMH/PML
- Чистый визуальный вид: уровни остаются постоянными для текущей сессии/недели/месяца
- Работает с любым символом и таймфреймом
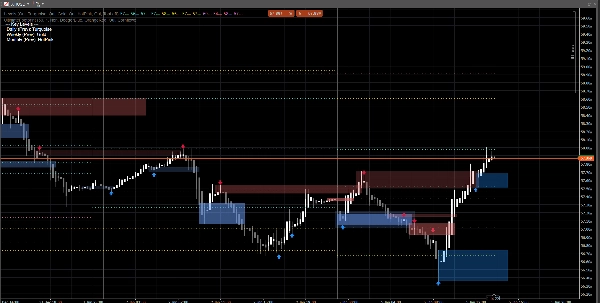
Настройка
Вы можете независимо включать или отключать каждый таймфрейм:
- Показывать дневные / недельные / месячные
- Установить индивидуальный цвет для каждой группы
- Включить простой легенду с возможностью выбора положения в углу
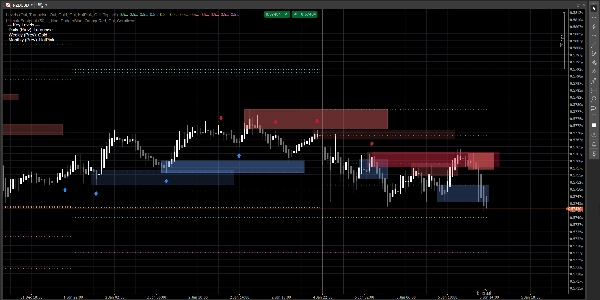
Технические заметки
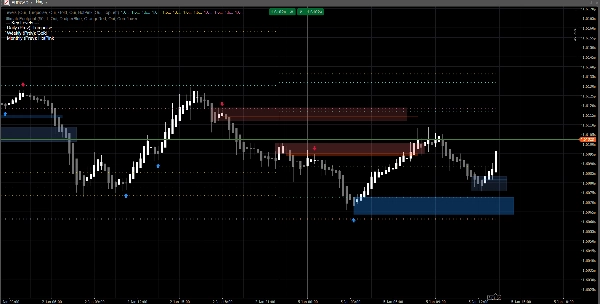
- Уровни рассчитываются с использованием предыдущей завершённой дневной/недельной/месячной свечи (не текущей формирующейся).
- Это предотвращает перерисовку и сохраняет уровни стабильными в течение сессии.
Отказ от ответственности
Этот индикатор предоставляется только для построения графиков и поддержки принятия решений. Он не генерирует сигналы на покупку/продажу и не является финансовой консультацией. Всегда управляйте рисками и проверяйте на собственных данных.
Сигналы на графике генерируются индикатором Ultimate Footprint, доступным в моём профиле.