Описание
📈 Стохастический RSI
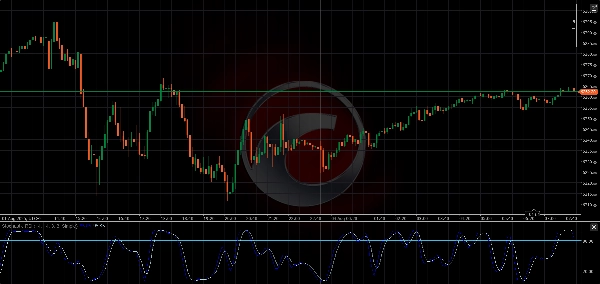
Индикатор Стохастический RSI — это осциллятор импульса, который применяет формулу Стохастика к значениям RSI, а не к цене, что делает его индикатором второго порядка. Он особенно полезен для определения зон перекупленности и перепроданности с большей чувствительностью, чем стандартный RSI.
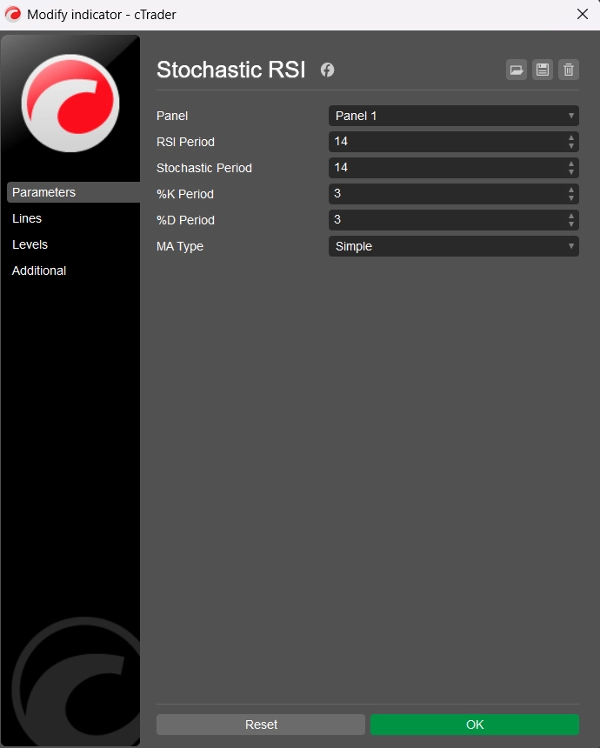
🛠️ Параметры
Период RSI: Период обратного отсчёта, используемый для расчёта базового RSI (по умолчанию = 14)
Период Стохастика: Период обратного отсчёта, применяемый к значениям RSI для вычисления Стохастического RSI (по умолчанию = 14)
Период %K: Период сглаживания для линии %K (по умолчанию = 3)
Период %D: Период сглаживания для линии %D (по умолчанию = 3)
Тип MA: Тип скользящей средней для сглаживания: Простая или Экспоненциальная (по умолчанию = Простая)
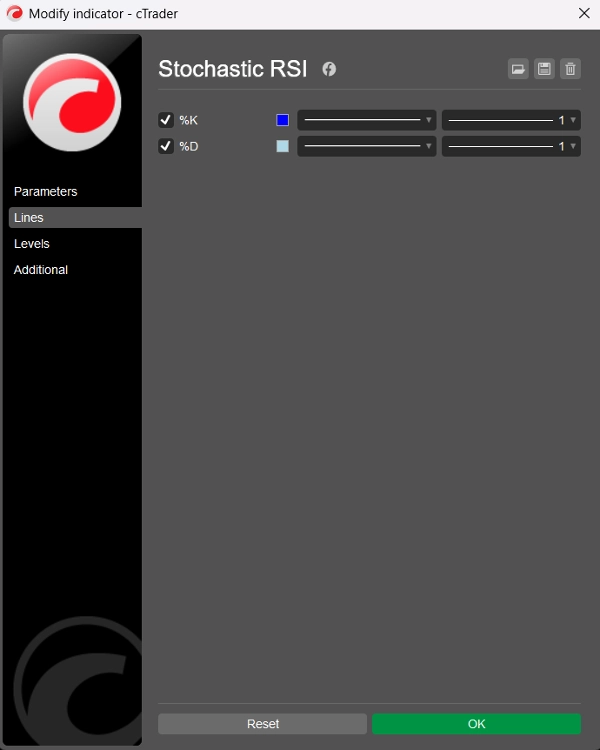
📊 Выходные линии
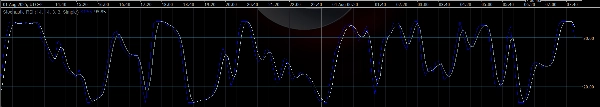
- Линия %K: Сглаженный Стохастический RSI (синий)
- Линия %D: Сглаженная скользящая средняя %K (голубой)
Обe линии колеблются между 0 и 100, что позволяет чётко определять зоны перекупленности и перепроданности.
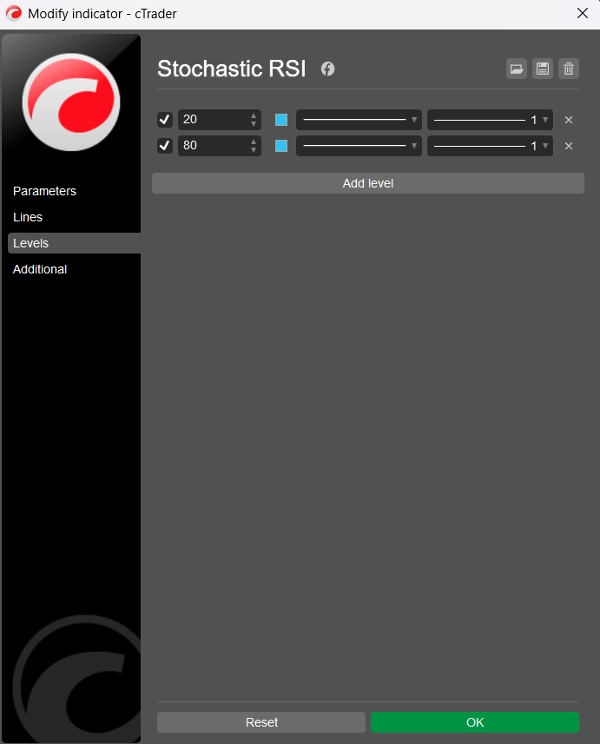
⚠️ Рекомендуемые уровни
Хотя индикатор по умолчанию не отображает статические уровни, рекомендуется добавить их вручную через вкладку «Уровни» в cTrader:
- Уровень 80 → Перекупленность
- Уровень 20 → Перепроданность
Эти уровни работают аналогично традиционному Стохастическому осциллятору, но применяются к поведению RSI, делая сигналы более чёткими и часто более быстрыми.
🧠 Как использовать
- Перекупленность (>80): Может указывать на чрезмерное повышение цены — возможен разворот или консолидация.
- Перепроданность (<20): Может сигнализировать о перепроданности цены — возможен отскок или разворот тренда.
- Пересечения %K и %D: Могут использоваться аналогично Стохастику или MACD — бычье пересечение ниже 20 или медвежье пересечение выше 80 может быть сигналом к действию.
🏷️ Примечания
- Создан для cTrader с использованием C# и Automate API
- Чистый, эффективный и настраиваемый с двумя типами скользящих средних
- Код и логика от BlueRocketBots & ChatGPT (OpenAI)
- Чистый код (всего 109 строк; 60 строк кода, 29 строк текста, 20 пустых строк)
- Бесплатно!